14

I'm trying to profile the memory usage of an IIS hosted WCF web application using JetBrains dotTRACE Memory.

In the past, I've successfully used dotTRACE Performance on this same web application and everything has worked fine, but I can't get dotTRACE Memory to start up.

All I get when I try to start the memory trace is this:
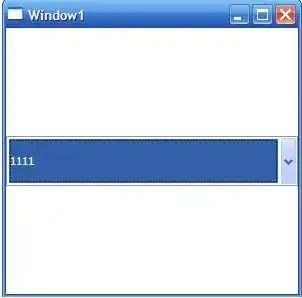
enter image description here

Searching through the (usually good) support documentation from JetBrains has found nothing.

Any ideas?

Server: Windows 2008 R2 (64 bit)
IIS: 7.0
dotTRACE Memory: 3.5.360 (latest available version as of today)

The application I want to provide is in a dedicated Application pool logging in via an Active Directory account.

Bevan
  • 43,618
  • 10
  • 81
  • 133

2 Answers2

15

dotTrace Memory 3.5 is published as x64 and x32. Which one are you using? IIS 7.0 application pool might be also x32 or x64. Which is yours? That must correspond, otherwise you will get "Connecting" and nothing more.

Ivan Shakhov
  • 1,299
  • 11
  • 12
  • 4
    This lead me to the solution. While I *was* using the x64 version of dotTRACE Memory 3.5, the installer had put it under "Program Files (x86)", an odd location for a 64 bit application. Changing my Application pool to 32 bit (by setting *Enable 32-Bit Applications* to true) made everything work. – Bevan Mar 14 '12 at 20:58
  • dotTrace for 64bit profiling is still a 32bit application, which is why it's in the x86 directory. – Kit Oct 09 '13 at 20:24
1

By default it does install it as a 32 bit application. I had to change the build of my WPF Application to x86 as Bevan mentioned above and everything works.

crazyDiamond
  • 1,070
  • 2
  • 16
  • 20