15

My goal is to trace drawings that have a lot of separate shapes in them and to split these shapes into individual images. It is black on white. I'm quite new to numpy,opencv&co - but here is my current thought:

  • scan for black pixels
  • black pixel found -> watershed
  • find watershed boundary (as polygon path)
  • continue searching, but ignore points within the already found boundaries

I'm not very good at these kind of things, is there a better way?

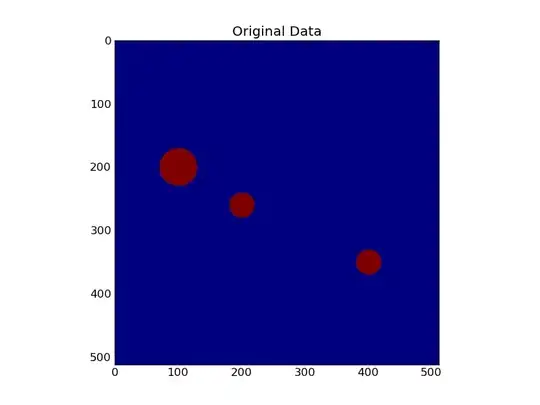
First I tried to find the rectangular bounding box of the watershed results (this is more or less a collage of examples):

from numpy import *
import numpy as np
from scipy import ndimage

np.set_printoptions(threshold=np.nan)

a = np.zeros((512, 512)).astype(np.uint8) #unsigned integer type needed by watershed
y, x = np.ogrid[0:512, 0:512]
m1 = ((y-200)**2 + (x-100)**2 < 30**2)
m2 = ((y-350)**2 + (x-400)**2 < 20**2)
m3 = ((y-260)**2 + (x-200)**2 < 20**2)
a[m1+m2+m3]=1

markers = np.zeros_like(a).astype(int16)
markers[0, 0] = 1
markers[200, 100] = 2
markers[350, 400] = 3
markers[260, 200] = 4

res = ndimage.watershed_ift(a.astype(uint8), markers)
unique(res) 

B = argwhere(res.astype(uint8))
(ystart, xstart), (ystop, xstop) = B.min(0), B.max(0) + 1 
tr = a[ystart:ystop, xstart:xstop]

print tr

Somehow, when I use the original array (a) then argwhere seems to work, but after the watershed (res) it just outputs the complete array again.

The next step could be to find the polygon path around the shape, but the bounding box would be great for now!

Please help!

bpat
  • 165
  • 1
  • 8

2 Answers2

16

@Hooked has already answered most of your question, but I was in the middle of writing this up when he answered, so I'll post it in the hopes that it's still useful...

You're trying to jump through a few too many hoops. You don't need watershed_ift.

You use scipy.ndimage.label to differentiate separate objects in a boolean array and scipy.ndimage.find_objects to find the bounding box of each object.

Let's break things down a bit.

import numpy as np
from scipy import ndimage
import matplotlib.pyplot as plt

def draw_circle(grid, x0, y0, radius):
    ny, nx = grid.shape
    y, x = np.ogrid[:ny, :nx]
    dist = np.hypot(x - x0, y - y0)
    grid[dist < radius] = True
    return grid

# Generate 3 circles...
a = np.zeros((512, 512), dtype=np.bool)
draw_circle(a, 100, 200, 30)
draw_circle(a, 400, 350, 20)
draw_circle(a, 200, 260, 20)

# Label the objects in the array. 
labels, numobjects = ndimage.label(a)

# Now find their bounding boxes (This will be a tuple of slice objects)
# You can use each one to directly index your data. 
# E.g. a[slices[0]] gives you the original data within the bounding box of the
# first object.
slices = ndimage.find_objects(labels)

#-- Plotting... -------------------------------------
fig, ax = plt.subplots()
ax.imshow(a)
ax.set_title('Original Data')

fig, ax = plt.subplots()
ax.imshow(labels)
ax.set_title('Labeled objects')

fig, axes = plt.subplots(ncols=numobjects)
for ax, sli in zip(axes.flat, slices):
    ax.imshow(labels[sli], vmin=0, vmax=numobjects)
    tpl = 'BBox:\nymin:{0.start}, ymax:{0.stop}\nxmin:{1.start}, xmax:{1.stop}'
    ax.set_title(tpl.format(*sli))
fig.suptitle('Individual Objects')

plt.show()

enter image description here enter image description here enter image description here

Hopefully that makes it a bit clearer how to find the bounding boxes of the objects.

Joe Kington
  • 275,208
  • 71
  • 604
  • 463
  • Thank both of you very much for your answers, I think this is it. Only one newbie numpy question if i may: I can't just save the area of the bounding rects, because other shapes will be 'peeking in'. So my plan is to multiply the image area by the inverted label array (so everything outside the current shape becomes black) and then save the image area with ndimage. Could you point me in the right direction how to do this? I know, as soon as i have the time I will carefully rtfm! – bpat Mar 13 '12 at 23:41
  • 1
    I think you just want `label == num` where `num` is the number of the object in `label` (the labeled array). Operations such as this are vectorized on numpy arrays, so it's literally the statement above. You'll get a boolean array of `True` inside the "object" and `False` outside. – Joe Kington Mar 14 '12 at 01:48
6

Use the ndimage library from scipy. The function label places a unique tag on each block of pixels that are within a threshold. This identifies the unique clusters (shapes). Starting with your definition of a:

from scipy import ndimage

image_threshold = .5
label_array, n_features =  ndimage.label(a>image_threshold)

# Plot the resulting shapes
import pylab as plt
plt.subplot(121)
plt.imshow(a)
plt.subplot(122)
plt.imshow(label_array)
plt.show()

enter image description here

Hooked
  • 84,485
  • 43
  • 192
  • 261