4

This is a follow-up to this question: What could explain the difference in memory usage reported by FastMM or GetProcessMemoryInfo?

My Delphi XE application is using a very large amount of memory which sometimes lead to an out of memory exception. I'm trying to understand why and what is causing this memory usage and while FastMM is reporting low memory usage, when requesting for TProcessMemoryCounters.PageFileUsage I can clearly see that a lot of memory is used by the application.

I would like to understand what is causing this problem and would like some advise on how to handle it:

  • Is there a way to know what is contained in that memory and where it has been allocated ?
  • Is there some tool to track down memory usage by line/procedure in a Delphi application ?
  • Any general advise on how to handle such a problem ?

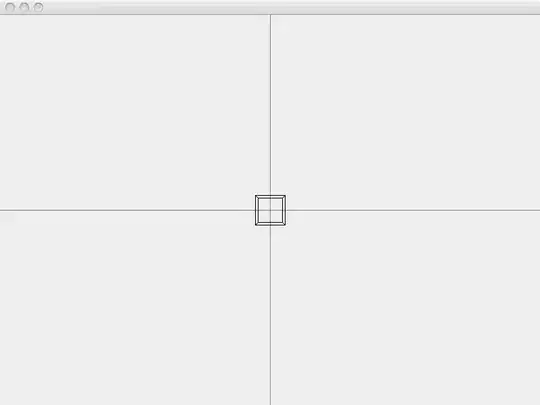
EDIT 1 : Here are two screenshots of FastMMUsageTracker indicating that memory has been allocate by the system.

  • Before process starts:

Before process starts

  • After process ends:

After process ends

Legend: Light red is FastMM allocated and dark gray is system allocated.

I'd like to understand what is causing the system to use that much memory. Probably by understanding what is contained in that memory or what line of code or procedure did cause that allocation.

EDIT 2 : I'd rather not use the full version of AQTime for multiple reasons:

  • I'm using multiple virtual machines for development and their licensing system is a PITA (I'm already a registered user of TestComplete)
  • LITE version doesn't provide enough information and I won't waste money without making certain the FULL version will give me valuable information

Any other suggestions ?

Community
  • 1
  • 1
jonjbar
  • 3,896
  • 1
  • 25
  • 46
  • 2
    The answers of this question [Profiler and Memory Analysis Tools for Delphi](http://stackoverflow.com/questions/291631/profiler-and-memory-analysis-tools-for-delphi) can help you. – RRUZ Mar 15 '12 at 13:47
  • @RRUZ It looks interesting but it looks like all answers are "time profiler" related and there is little to no information about memory usage profiling – jonjbar Mar 15 '12 at 14:03
  • I would try to periodically log the values returned by FastMM for gray areas from different places of your app code, together with a short location info, to a log file. I am working on a generic tool (VisualMM) which also displays a time line, see http://mikejustin.wordpress.com/ – mjn Mar 18 '12 at 09:34
  • You can use the trial period to see if the full version will give you the information you need. – Lars Truijens Mar 18 '12 at 21:24
  • @Lars I could try but will it install in a VM ? I couldn't trial TestComplete on my main development VM before purchasing, how stupid is that :( – jonjbar Mar 19 '12 at 08:14

2 Answers2

4

You need a profiler, but even that won't be enough in lots of places and cases. Also, in your case, you would need the full featured AQTime, not the lite version that comes with Delphi XE and XE2. (AQTIME is extremely expensive, and annoyingly node-locked, so don't think I'm a shill for SmartBear software.)

The thing is that people often mistake AQTime Allocation Profiler as only a way to find leaks. It can also tell you where your memory goes, at least within the limits of the tool. While running, and consuming lots of memory, I click Run -> Get Results.

Here is one of my applications being profile in AQTime with its Allocation Profiler showing exactly what class is allocating how many instances on the heap and how much memory those use. Since you report low Delphi heap usage with FastMM, that tells me that most of AQTime's ability to analyze by delphi class name will also be useless to you. However by using AQTime's events and triggers, you might be able to figure out what areas of your application are causing you a "memory usage expense" and when those occur, what the expense is. AQTime's real-time instrumentation may be sufficient to help you narrow down the cause even though it might not find for you what function call is causing the most memory usage automatically.

enter image description here enter image description here enter image description here The column names include "Object Name" which includes things like this: * All delphi classes, and their instance count and heap usage. * Virtual Memory blocks allocated via Win32 calls.

It can detect Delphi and C/C++ library allocations on the heap, and can see certain Windows-API level memory allocations.

Note the live count of objects, the amount of memory from the heap that is used.

I usually try to figure out the memory cost of a particular operation by measuring heap memory use before, and just after, some expensive operation, but before the cleanup (freeing) of the memory from that expensive operation. I can set event points inside AQTime and when a particular method gets hit or a flag gets turned on by me, I can measure before, and after values, and then compare them.

FastMM alone can not even detect a non-delphi allocation or an allocation from a heap that is not being managed by FastMM. AQTime is not limited in that way.

Warren P
  • 65,725
  • 40
  • 181
  • 316
  • @Warrent Thanks, I tried your solution (AQTime Lite only, as full version is too restrictive or expensive) but I see very different memory usage results (Checked system memory too): AQTime reports 81,339,834 when TProcessMemoryCounters.PageFileUsage reports 983,592,960. Is it due to the lite version ? Also how to interpret the result to get something useful: VCL native memory or Committed Virtual Memory doesn't help much ? – jonjbar Mar 15 '12 at 17:05
  • I very much doubt you will get much use out of the LITE version as I stated clearly above! Since it lacks support in LITE version for the EVENTS, or even the same LIVE VIEWS I show above, the use of the LITE version is going to be very limited for your needs. – Warren P Mar 15 '12 at 17:05
  • I have access to the live view as shown above. However I'm not sure why the lite version would report such difference in memory usage based on comparison with full version: http://support.smartbear.com/products/more-info/aqtime/standard-for-rad-studio-vs-pro ? – jonjbar Mar 15 '12 at 17:14
  • Because the full version can analyze memory usage in non-delphi-heap sources including VC++ C/C++ runtime heap malloc etc. – Warren P Mar 15 '12 at 17:55
  • I've updated my question to clarify that I'd avoid using AQTime due to licensing restrictions and because I'm not sure the Full version will provide valuable information. – jonjbar Mar 18 '12 at 08:42
  • I'm not sure you have any other reasonable alternatives, John. If you're desperate, you might look into some "tracing" tools that can give you an idea of what Windows APIs or other activity are involved. The SysInternals suite has a lot of good tools that might help you see stuff: http://technet.microsoft.com/en-us/sysinternals – Warren P Mar 19 '12 at 13:35
  • Thank you for your very detailed answer Warren. I'm sorry I couldn't accept it because of the AQTime license :( Problem was about TPngImage and I can't understand it, I replaced it by a PNG library from DevExpress and it is using far less memory. Thanks. – jonjbar Mar 22 '12 at 16:04
4

Another problem might be heap fragmentation. This means you have enough memory free, but all the free blocks are to small. You might see it visually by using the source version of FastMM and use the FastMMUsageTracker.pas as suggested here.

Community
  • 1
  • 1
Lars Truijens
  • 42,837
  • 6
  • 126
  • 143
  • This is interesting and it looks like it proves that it's not due to free blocks. Here is a before graph: http://i.imgur.com/uYFBq.png - And the graph when memory is full: http://i.imgur.com/fpfet.png - Any idea how I can continue investigation ? – jonjbar Mar 16 '12 at 09:10
  • 1
    If it's not heap fragmentation I would advice to use tools like AQTime as @Warren suggests – Lars Truijens Mar 16 '12 at 10:00
  • I've updated my question to clarify that I'd like to avoid AQTime. Any other tool you'd suggest ? – jonjbar Mar 18 '12 at 08:43
  • No, I know of no other tool that will work with Delphi and give you this level of detail. Except FastMM, but that will only report it's own memory – Lars Truijens Mar 18 '12 at 10:35
  • I'm accepting your answer as this is the one who provided me the most information. Problem was about TPngImage and I can't understand it, I replaced it by a PNG library from DevExpress and it is using far less memory. Thanks. – jonjbar Mar 22 '12 at 16:03