6

I have a PHP website on a Apache server, and I would like to know if there are tools and other ways I can profile this to find bottlenecks on the code. What I need to know is what functions are taking long to process, etc.

Something like gprof, except for PHP on live apache server.

What are other ways to find bottlenecks in a PHP system.
The Unknown
  • 19,224
  • 29
  • 77
  • 93
  • i'm not sure it's a good idea to run an expensive profiler on a live website. profiling slows your app down significantly. better create a local copy and do the profiling there (this also removes the risk of downtime due to profiler installation problems). – stefs Jun 09 '09 at 20:16

9 Answers9

8

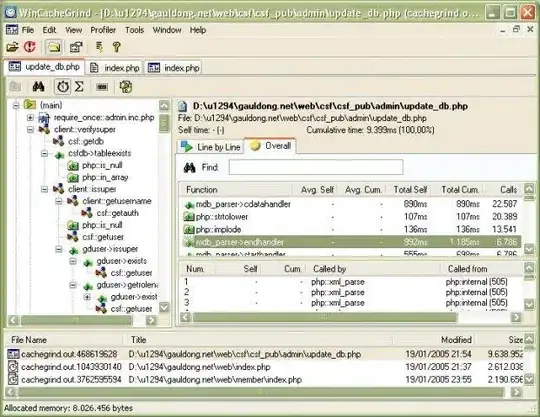
You can use xdebug - once installed you can trigger profiling of requests in a variety of ways, and you wind up with a valgrind format profile for each request. Load this in WinCacheGrind, KCacheGrind or similar and drill down to find where all the time is spent!

alt text

Community
  • 1
  • 1
Paul Dixon
  • 295,876
  • 54
  • 310
  • 348
  • 1
    +1 up vote - Xdebug is the best FOSS option out there, but if you start adding servers, Zend Platform is going to have additional tools to bring to bear for performance optimization. – Pro777 Jun 09 '09 at 20:15
  • Zend Platform is excellent if you manage multiple servers, but it's a bit old and tough to install/configure. The successor, Zend Server, isn't feature-complete, but is quite good already and much easier to install (RPM or DEB packages). Also, the Community Edition is free. – Martijn Heemels Jun 09 '09 at 21:00
  • 2
    xdebug and kcachegrind worked perfectly and isolated the bottlenecks I had to find pretty much instantly once I had the trace file loaded. – pdwalker Oct 19 '11 at 12:27
4

Try XDebug ( http://www.xdebug.org/ ) you can trigger it with a get-parameter during your debugging-session. This will create cachegrind-files which you can check within KCacheGrind or WinCacheGrind (this first is much better)...

pagid
  • 13,559
  • 11
  • 78
  • 104
3

XHProf was designed for this use case.

XHProf (open sourced by Facebook in 2009) powers Facebook's XHProfLive -- a real-time performance monitoring system that provides function level insights from production tiers.

A snippet from XHProf doc:

XHProf is a light-weight instrumentation based profiler. During the data collection phase, it keeps track of call counts and inclusive metrics for arcs in the dynamic callgraph of a program. It computes exclusive metrics in the reporting/post processing phase. XHProf handles recursive functions by detecting cycles in the callgraph at data collection time itself and avoiding the cycles by giving unique depth qualified names for the recursive invocations.

XHProf's light-weight nature and aggregation capabilities make it well suited for collecting "function-level" performance statistics from production environments.

regards, Kannan Muthukkaruppan

Mikko Rantalainen
  • 14,132
  • 10
  • 74
  • 112
kannan
  • 31
  • 1
1

dtrace has low overhead

dtrace in fact has almost zero overhead unless you enable thousands of probes think it is also available on the BSD's

edik
  • 11
  • 1
1

Let me also mention Pinba
In my opinion, it is more suitable for the multiple servers setup rather than for just one server, but in case your project grow..

Your Common Sense
  • 156,878
  • 40
  • 214
  • 345
1

if you have a very targeted area to look at, you may want to try sprinkling these around your code:

$f_timeStart=microtime(true);
$f_timeLast=$f_timeStart;


error_log(sprintf("%'08.5f",(microtime(true)-$f_timeLast)).' - '.sprintf("%'05.2f",(microtime(true)-$f_timeStart)).' secs - '.'01 before xyz()'."\n", 3, '/var/tmp/my-errors.log');
$f_timeLast=microtime(true);
xyz();
error_log(sprintf("%'08.5f",(microtime(true)-$f_timeLast)).' - '.sprintf("%'05.2f",(microtime(true)-$f_timeStart)).' secs - '.'01 after xyz()'."\n", 3, '/var/tmp/my-errors.log');
$f_timeLast=microtime(true);
KM.
  • 101,727
  • 34
  • 178
  • 212
0

If you are running on OpenSolaris, consider dtrace. The biggest advantage probably is that you can also probe into other layers like Apache, Mysql. dtrace has low overhead and you can selectively enable only the probes that you want to monitor.

CruiZen
  • 182
  • 2
  • 6
0

You can use phpdebug for this job. It's a php extension.

f00860
  • 3,486
  • 7
  • 41
  • 59
0

I would suggest against building your own profiler. There are several excellent profilers freely available that will give you extensive detail and ease of use. I think your best time investment is in the following combination. We use this at the web developent company I work for, and are very pleased with it:

  1. The Zend Server php stack:
    You can use the free Community Edition, and choose which parts of the stack you want to install. We installed only the PHP part, and rely on the Apache and MySQL from the Linux distro. Zend Server provides a Debugger extension, a code optimizer (for a slight speed boost), a bytecode cache (for a substantial speed boost) and a nice GUI for managing PHP settings. The commercial version provides much more. Installation in Linux is easy via RPM or DEB packages.

  2. To use the Debugger extension you need an IDE:
    Install Zend Studio which is an excellent PHP IDE (check the features page), and makes debugging and profiling very easy. No need to make cachegrind files, or other multistep processes, but just click Profile in the toolbar in Firefox and Studio starts profiling that page. The detail and ease of use are huge.

Maybe I'm sounding like a Zend salesman, and maybe this sounds like more than you need, but I'm just a PHP developer who is very happy with the tools he uses. I think it's time well spent to start using Studio, but the combination makes it great and Server will even speed up your live server quite a bit. In my opinion this combo is simply the best PHP development environment currently available. Check out the demo videos. There's one on profiling too.

Martijn Heemels
  • 3,529
  • 5
  • 37
  • 38