The output from a SQL Server trace in profiler contains the columns CPU and Duration (amongst others). What units are these values in?
Asked
Active
Viewed 8.7k times
4 Answers
100
CPU is in milliseconds. In sql server 2005 and later, duration is in microseconds when saved to a file or a table, and milliseconds in the user interface. In sqlserver 2000, it is always in milliseconds. From MSDN.
User jerryhung gives a more accurate version-specific information in a comment:
Beginning with SQL Server 2005, the server reports the duration of an event in microseconds (one millionth, or 10-6 of a second) and the amount of CPU time used by the event in milliseconds (one thousandth, or 10-3 of a second). In SQL Server 2000, the server reported both duration and CPU time in milliseconds. In SQL Server 2005 and later, the SQL Server Profiler graphical user interface displays the Duration column in milliseconds by default, but when a trace is saved to either a file or a database table, the Duration column value is written in microseconds.
Sir Crispalot
- 4,792
- 1
- 39
- 64
RolandTumble
- 4,633
- 3
- 32
- 37
-
Thanks - it was actually a SQL2000 log I was looking at which reports in milliseconds which the link also answered. – PaulB Jun 10 '09 at 16:49
-
21Beginning with SQL Server 2005, the server reports the duration of an event in microseconds (one millionth, or 10-6, of a second) and the amount of CPU time used by the event in milliseconds (one thousandth, or 10-3, of a second). In SQL Server 2000, the server reported both duration and CPU time in milliseconds. In SQL Server 2005 and later, the SQL Server Profiler graphical user interface displays the Duration column in milliseconds by default, but when a trace is saved to either a file or a database table, the Duration column value is written in microseconds. – jerryhung Mar 09 '10 at 14:52
-
4Can this answer be edited to be clear please. The original answer (Marked as Correct) is incorrect if you are referring to the column in the Profiler because as indicated by the jerryhung comment it is infact displayed as milliseconds. – Feb 07 '11 at 21:20
-
It should be noted that Duration is always milliseconds (even after saving to a table) when running a Profiler trace on _Analysis Services_. It wasn't immediately obvious for me and documentation was unclear so I verified it first hand. Some documentation here. https://learn.microsoft.com/en-us/analysis-services/trace-events/queries-events-data-columns?view=asallproducts-allversions – Gabe Jan 06 '22 at 17:01
5
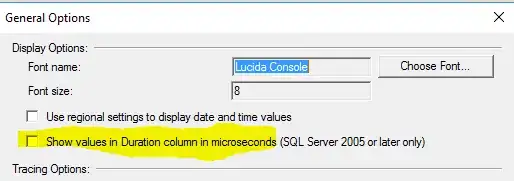
According to the documentation (for SQL Server Profiler 2016) the default unit for the Duration column is milliseconds.
Show values in Duration column in microseconds Displays the values in microseconds in the Duration data column of traces. By default, the Duration column displays values in milliseconds.
It can be changed to microseconds in the General Options: Tools->Options
Nothing wrong with using 2016 profiler on older versions of the DBMS.
Nelda.techspiress
- 643
- 12
- 32
1
I found in SQL Server 2017, that duration showed as milliseconds in the Profiler view, but when I exported to a table it showed in microseconds. A bit confusing at first.
Paul Lee
- 11
- 1
0
This confused me a lot and this is why.
In 2023 we have 2 similar ways to profile SQL Server, both are build-in. First - open SSMS Tools window and select SQL Profiler. This will open a profiler as a separate application. The second modern way called XEvent Profiler and located directly in SSMS under all other groups in SSMS Object Explorer:

If you open SQL Profiler from the tools menu you will see Duration in milliseconds (for example 1000 means 1 second).
But if you open XEvent Profiler from Object Explorer it shows Duration in microseconds (for example 1000000 means 1 second).
I hope this can save someone a lot of time.
Mike Keskinov
- 11,614
- 6
- 59
- 87