30

I am learning chrome extension by example. Here is the example I currently learning: http://www.chrome-extensions.net/extensions/mappy/

There are three JavaScript files in this sample project: background.js mappy_content_script.js popup.js.

"mappy_content_script.js" is shown in the Combo box of Scripts tab of Developer Tools.
"popup.js" can be found if I right click the extension icon and choose "Inspect popup".

The problem is I can't debug "background.js" or find it in the Developer Tools. I tried insert "debugger;" in this JavaScript file. I also tried use profiling tool to record the script execution. However, when I click the link of "background.js", a blank page shows up. Profile Tool
Is this a bug of chrome or did I miss something? Thanks

Liam
  • 27,717
  • 28
  • 128
  • 190
Xiong
  • 617
  • 1
  • 8
  • 12

3 Answers3

39

background.js is loaded in the background. To inspect it visit chrome://extensions, find the loaded extension, and "inspect active views" for the background script.

Edit

Below is a screenshot of the chrome extensions page. A click on the link background page opens the background page for this extension.

Chrome Extensions page

Additional information

EDIT 2020

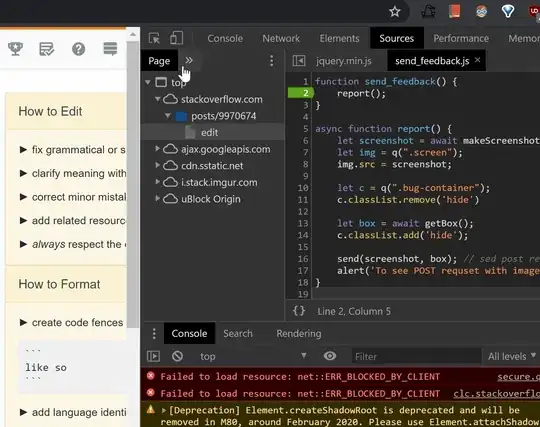
Here is how you can see the content scripts and debug,

enter image description here

Community
  • 1
  • 1
abraham
  • 46,583
  • 10
  • 100
  • 152
  • 1
    Great! Thank you very much! I wish google could consolidate these three debugging context into just one. – Xiong Apr 02 '12 at 03:54
  • Not sure what's going on in the animation or if things have changed but I now get to the debug console via chrome://extensions/ -> Inspect views: background page – Jonathan Rys Nov 02 '20 at 19:39
9

Nowadays you have to install a Chrome extension to allow you to inspect the view of a page, specifically the Develop and Debug Chrome Apps & Extensions

Nels Beckman
  • 20,508
  • 3
  • 24
  • 28
0

There is an easy way to access your extension code in DevTool and debug it.

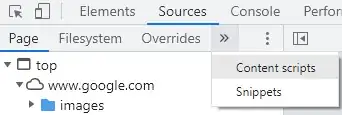
Open the DevTool (e.g. F12) , click on "Sources" tab then look for "Content Scripts" menu next to Page , Filesystem, Overrides etc. and click on it .

enter image description here

you should see all active extensions listed there and you can easily add break point to each js code and reload the page to debug through

pref
  • 1,651
  • 14
  • 24