This article was co-authored by Bess Ruff, MA. Bess Ruff is a Geography PhD student at Florida State University. She received her MA in Environmental Science and Management from the University of California, Santa Barbara in 2016. She has conducted survey work for marine spatial planning projects in the Caribbean and provided research support as a graduate fellow for the Sustainable Fisheries Group.
There are 13 references cited in this article, which can be found at the bottom of the page.
This article has been viewed 85,859 times.
Data analysis is an important step in answering an experimental question. Analyzing data from a well-designed study helps the researcher answer questions. With this data, you can also draw conclusions that further the research and contribute to future studies. Keeping well-organized data during the collection process will help make the analysis step that much easier.
Steps
Organizing the Data
-
1Use an electronic database to organize the data. Copy the data into a new file for editing. You never want to work on the master data file in case something gets corrupted during the analysis process. A program such as Excel allows you to organize all of your data into an easily searchable spreadsheet. You can add filters to your data to make it easier to copy and paste discrete datasets between files.[1]
- Take care when transferring data into the master spreadsheet. It is easy to accidentally copy and paste into the wrong columns or rows.
- In case something does happen to the data, you can always go back to the original master file.
-
2Code text responses into numerical form. If you are working with survey data that has written responses, you will need to code the data into numerical form before you can analyze it.[2] You may have to develop your own coding system for responses based on the information you have received and the questions you are trying to answer with your data.
- Code “No” responses as “0” and “Yes” responses as “1.”
Advertisement -
3Develop a system to group your data. As you start collecting data, start thinking about the best way to group everything. If you’re working with human subjects or responses, you’ll need to give each person a number or letter code to protect confidentiality.[3]
- It may be easiest to keep all of your groups on separate sheets within one document, completely separate documents, or different columns/rows within the same sheet.
- Talk to others who have done similar data analysis to get an idea of how best to organize your data.
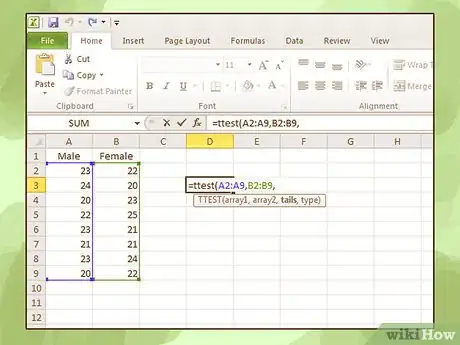
- For example: If you want to know differences between males and females, you would want to make sure all of the male data was grouped together and all of the female data was grouped together.
-
4Check the data for mistakes. When organizing data, there can be a lot of copying and pasting between files. Periodically check the master file against the data you have organized to make sure that numbers haven’t been mixed up or placed in the wrong columns.[4]
- If you have to manually enter data, make sure to double-check everything that gets entered.
Choosing Statistical Tests
-
1Run a t-test to compare two groups. A t-test is a very common statistical test used to compare the means (averages) of samples. A one-sample t-test is used to test that the average sample is statistically significant from a known value. A two-sample t-test is used to test that two groups have statistically different means.[5]
- One sample t-tests are generally used in physics and product manufacturing: you know the value that your sample should have so you compare the average that you get to that known value.[6]
- Two sample t-tests are commonly used in the biomedical and clinical fields.
-
2Use an ANOVA to analyze means of groups. An ANOVA (analysis of variance) is very commonly used in the biomedical fields to compare means of multiple groups. ANOVAs are a very powerful tool for finding differences when you are looking at many comparisons.
- A one-way ANOVA can be used to compare the means of multiple groups to one control group. For example, if you had one control group and three test groups, you would use a one-way ANOVA to compare all of the means and see if any are different.[7]
- A two-way ANOVA is used to compare the means of multiple groups with multiple variables. For example, if you wanted to know if both genotype and sex of an organism affected your data, you would run a two-way ANOVA against the control groups.[8]
-
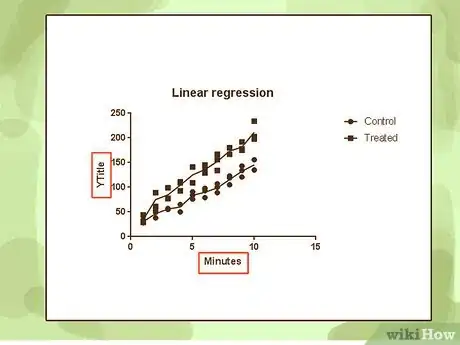
3Run a linear regression to test variable effects. A linear regression test looks at the variation of the independent variable and tests to see whether that variation is causing the variation seen in the dependent variable.[9]
- This test is used when you want to measure the strength of association between two variables.
- For example, if you wanted to test the relationship between your heart rate and the speed you move on a treadmill, you would use a linear regression.
-
4Use an ANCOVA to compare two regression lines. If you want to compare the relationship of two different groups to the same variable, you can use an ANCOVA (analysis of covariance). An ANCOVA allows you to control for the variation you might see from the independent variable between two groups.[10]
- For example, if you wanted to test to see if males and females had different resting heart rates at different temperatures you would use an ANCOVA. You would make two regression lines (one for females and one for males) of heart rate vs temperature. Then you would use an ANCOVA to compare the two lines to see if they were different.
-
5Explore more statistical tests on your own. The tests presented are not an exhaustive list of tests available. These are some of the more common tests used, but there are many variations and more complex tests that may be better for your data. When planning your experiments, do a thorough search to decide which tests to use.
- There are some helpful charts and articles online to assist you in choosing a test based on the data you are collecting.[11]
- Look at articles from the NIH and universities or online statistics books for more information.
Analyzing the Data
-
1Clearly define the research questions. Never lose focus of the study and stick to the research design and defined variables. A good research strategy involves running well designed experiments and collecting the right amount of data to answer the research question.
- Before you begin collecting data, you should know exactly how many samples you are going to collect in each group and what statistical tests you will run.
-
2Consult a statistician. Statistics can get very complicated very quickly, especially with large datasets. Before you begin the experiment, discuss everything with a statistician. They can help you figure out what tests are appropriate for analyzing your data and how many samples you will need in each group to have the proper power to run your tests.[12]
- It is also a good idea to meet with them again after the data has been collected. They can help you analyze the data and make sure everything has been done properly.
- Ask them about the proper size of your study, what types of statistical tests will help you answer your research questions, and what the limitations of the tests are.
- Remember, a statistical test simply tells you the probability of an outcome occurring or not occurring. You must be careful not to confuse statistical significance with clinical significance or physiological relevance.[13]
-
3Run the chosen statistical tests. Once the data has been collected and prepared, you can start to run all of the tests you decided to run before the experiment began. Programs specific for analyzing data should be used for this process. These tests are complex and it is much easier to run them using a program such as SAS, R, Stata, or GraphPad Prism.
- SAS, Stata, and R require some programming experience. You may need to consult someone trained to use these programs or take a course to become proficient in their use.
Presenting the Data
-
1Make graphs that are publication quality. There are many software programs that allow you to turn your data into nice graphs. Statistical analysis programs also have graphing capabilities that produce publication quality figures. Transfer your data into one of these programs and make them into a graph.[14]
- Commonly used programs are GraphPad Prism and R.
-
2Label all axes clearly. When presenting data, it is important to label everything clearly so people can easily interpret what the graph is telling them. All axes need to be labeled with an easy-to-read font at a size large enough to read without squinting.[15]
- If you have multiple datasets on a single graph, make sure they are all properly labeled.
-
3Use asterisks to denote significance. On the figures that have significant differences between groups, you want to indicate that directly on the figure. Draw a line between the two groups that are significantly different and place an asterisk above the line.
- Make sure the figure legend explains what the asterisk means, what statistical test was used, and what the actual p-value of the test was.
-
4Group similar data together. If you have multiple graphs of data that are similar, group them together into one figure. It will help you understand the data if you can look at all of the similar data at the same time. It is easier to see trends and draw conclusions about your data.
- Many programs have graph editors that also allow you to make layouts of multiple graphs.
- Make sure all of the graphs have the same font sizes and use the same symbols between datasets.
-
5Write a detailed figure legend. The figure legend allows anyone looking at your data to understand what exactly is being presented in the graph. The legend should tell the reader how many replicates are within each group and what statistical tests were used to analyze the data.[16]
- Details about the statistics should be included in the legend as well: z-scores, t-scores, p-values, degrees of freedom, etc.
References
- ↑ http://toolkit.pellinstitute.org/evaluation-guide/analyze/enter-organize-clean-data/
- ↑ https://www.wilder.org/sites/default/files/imports/crimevictimservices13_2-08Web.pdf
- ↑ http://toolkit.pellinstitute.org/evaluation-guide/analyze/enter-organize-clean-data/
- ↑ http://toolkit.pellinstitute.org/evaluation-guide/analyze/enter-organize-clean-data/
- ↑ http://www.biostathandbook.com/testchoice.html
- ↑ http://www.biostathandbook.com/onesamplettest.html
- ↑ http://www.biostathandbook.com/onewayanova.html
- ↑ http://www.biostathandbook.com/twowayanova.html
- ↑ http://www.biostathandbook.com/linearregression.html
- ↑ http://www.biostathandbook.com/ancova.html
- ↑ http://www.ncbi.nlm.nih.gov/pmc/articles/PMC3116565/
- ↑ https://ori.hhs.gov/education/products/n_illinois_u/datamanagement/datopic.html
- ↑ https://ori.hhs.gov/education/products/n_illinois_u/datamanagement/datopic.html
- ↑ http://cellbio.emory.edu/bnanes/figures/
- ↑ http://www.scidev.net/global/publishing/practical-guide/how-do-i-write-a-scientific-paper-.html
- ↑ http://www.biosciencewriters.com/Tips-for-Writing-Outstanding-Scientific-Figure-Legends.aspx
About This Article
To conduct data analysis, you’ll need to keep your information well organized during the collection process. Use an electronic database, such as Excel, to organize all of your data in an easily searchable spreadsheet. If you’re working with survey data that has written responses, you can code the data into numerical form before analyzing it. When you’re ready to start analyzing your data, run all of the tests you decided on before the experiment began. For example, if you need to compare the means of samples, use a t-test. Alternatively, to analyze means of groups, you’ll want to use an analysis of variance. To learn how to present your data, keep reading!


-Step-17.webp)


