Flovilla, Georgia | |
|---|---|
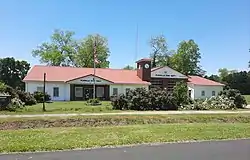 Flovilla City Hall | |
 Location in Butts County and the state of Georgia | |
| Coordinates: 33°15′20″N 83°53′54″W / 33.25556°N 83.89833°W | |
| Country | United States |
| State | Georgia |
| County | Butts |
| Area | |
| • Total | 1.96 sq mi (5.07 km2) |
| • Land | 1.96 sq mi (5.07 km2) |
| • Water | 0.00 sq mi (0.00 km2) |
| Elevation | 541 ft (165 m) |
| Population (2020) | |
| • Total | 643 |
| • Density | 328.40/sq mi (126.80/km2) |
| Time zone | UTC-5 (Eastern (EST)) |
| • Summer (DST) | UTC-4 (EDT) |
| ZIP code | 30216 |
| Area code | 770 |
| FIPS code | 13-30312[2] |
| GNIS feature ID | 0355853[3] |
| Website | cityofflovilla |
Flovilla is a city in Butts County, Georgia, United States. The population was 653 at the 2010 census.[4]
Indian Springs State Park is nearby.
History
Flovilla incorporated in 1885.[5] Flovilla is a coined name meaning "village of flowers".[6]
Geography
Flovilla is located in southeastern Butts County at 33°15′20″N 83°53′54″W / 33.255441°N 83.898218°W.[7] U.S. Route 23 passes through the center of the city, leading northwest 5 miles (8 km) to Jackson, the county seat, and southeast 34 miles (55 km) to Macon. Indian Springs State Park is located 2 miles (3 km) west of the city along Georgia State Route 42 and contains a lake, a campground, and the springs for which it is named.
According to the United States Census Bureau, the city has a total area of 2.0 square miles (5.1 km2), all land.[4]
Demographics
| Census | Pop. | Note | %± |
|---|---|---|---|
| 1890 | 422 | — | |
| 1900 | 523 | 23.9% | |
| 1910 | 495 | −5.4% | |
| 1920 | 371 | −25.1% | |
| 1930 | 230 | −38.0% | |
| 1940 | 240 | 4.3% | |
| 1950 | 315 | 31.3% | |
| 1960 | 284 | −9.8% | |
| 1970 | 289 | 1.8% | |
| 1980 | 458 | 58.5% | |
| 1990 | 602 | 31.4% | |
| 2000 | 652 | 8.3% | |
| 2010 | 653 | 0.2% | |
| 2020 | 643 | −1.5% | |
| U.S. Decennial Census[8] | |||
2020 census
| Race / Ethnicity | Pop 2010[9] | Pop 2020[10] | % 2010 | % 2020 |
|---|---|---|---|---|
| White alone (NH) | 322 | 328 | 49.31% | 51.01% |
| Black or African American alone (NH) | 316 | 270 | 48.39% | 41.99% |
| Native American or Alaska Native alone (NH) | 0 | 0 | 0.00% | 0.00% |
| Asian alone (NH) | 2 | 3 | 0.31% | 0.47% |
| Pacific Islander alone (NH) | 0 | 0 | 0.00% | 0.00% |
| Some Other Race alone (NH) | 0 | 3 | 0.00% | 0.47% |
| Mixed Race/Multi-Racial (NH) | 4 | 25 | 0.61% | 3.89% |
| Hispanic or Latino (any race) | 9 | 14 | 1.38% | 2.18% |
| Total | 653 | 643 | 100.00% | 100.00% |
2000 Census
As of the census[2] of 2000, there were 652 people, 206 households, and 172 families residing in the city. The population density was 334.7 inhabitants per square mile (129.2/km2). There were 222 housing units at an average density of 114.0 per square mile (44.0/km2). The racial makeup of the city was 47.85% White, 51.53% African American, 0.15% Native American, and 0.46% from two or more races. Hispanic or Latino of any race were 1.53% of the population.
There were 206 households, out of which 38.3% had children under the age of 18 living with them, 55.8% were married couples living together, 18.0% had a female householder with no husband present, and 16.5% were non-families. 13.1% of all households were made up of individuals, and 4.9% had someone living alone who was 65 years of age or older. The average household size was 3.17 and the average family size was 3.47.
In the city, the population was spread out, with 29.8% under the age of 18, 11.2% from 18 to 24, 27.0% from 25 to 44, 23.9% from 45 to 64, and 8.1% who were 65 years of age or older. The median age was 31 years. For every 100 females, there were 95.2 males. For every 100 females age 18 and over, there were 94.1 males.
The median income for a household in the city was $38,194, and the median income for a family was $42,679. Males had a median income of $26,507 versus $18,750 for females. The per capita income for the city was $15,712. About 13.0% of families and 12.3% of the population were below the poverty line, including 15.0% of those under age 18 and 20.0% of those age 65 or over.
References
- ↑ "2020 U.S. Gazetteer Files". United States Census Bureau. Retrieved December 18, 2021.
- 1 2 "U.S. Census website". United States Census Bureau. Retrieved January 31, 2008.
- ↑ "US Board on Geographic Names". United States Geological Survey. October 25, 2007. Retrieved January 31, 2008.
- 1 2 "Geographic Identifiers: 2010 Demographic Profile Data (G001): Flovilla city, Georgia". U.S. Census Bureau, American Factfinder. Archived from the original on February 12, 2020. Retrieved November 8, 2013.
- ↑ "Flovilla". GeorgiaGov. Retrieved May 24, 2018.
- ↑ "City History". City of Flovilla. Retrieved May 24, 2018.
- ↑ "US Gazetteer files: 2010, 2000, and 1990". United States Census Bureau. February 12, 2011. Retrieved April 23, 2011.
- ↑ "Census of Population and Housing". Census.gov. Retrieved June 4, 2015.
- ↑ "P2 HISPANIC OR LATINO, AND NOT HISPANIC OR LATINO BY RACE – 2010: DEC Redistricting Data (PL 94-171) – Flovilla city, Georgia". United States Census Bureau.
- ↑ "P2 HISPANIC OR LATINO, AND NOT HISPANIC OR LATINO BY RACE - 2020: DEC Redistricting Data (PL 94-171) - Flovilla city, Georgia". United States Census Bureau.
Municipalities and communities of Butts County, Georgia, United States | ||
|---|---|---|
| Cities |  Map of Georgia highlighting Butts County | |
| Unincorporated communities | ||