Hohenselchow-Groß Pinnow | |
|---|---|
Location of Hohenselchow-Groß Pinnow within Uckermark district  | |
 Hohenselchow-Groß Pinnow 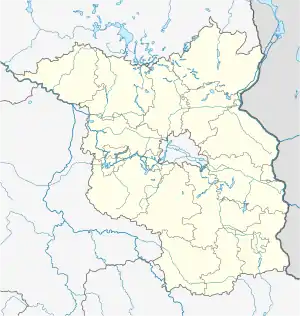 Hohenselchow-Groß Pinnow | |
| Coordinates: 53°12′N 14°17′E / 53.2°N 14.28°E | |
| Country | Germany |
| State | Brandenburg |
| District | Uckermark |
| Municipal assoc. | Gartz (Oder) |
| Government | |
| • Mayor (2019–24) | Angelika Böcker[1] |
| Area | |
| • Total | 41.10 km2 (15.87 sq mi) |
| Elevation | 45 m (148 ft) |
| Population (2021-12-31)[2] | |
| • Total | 717 |
| • Density | 17/km2 (45/sq mi) |
| Time zone | UTC+01:00 (CET) |
| • Summer (DST) | UTC+02:00 (CEST) |
| Postal codes | 16306 |
| Dialling codes | 033331 |
| Vehicle registration | UM |
| Website | www.gartz.de |
Hohenselchow-Groß Pinnow is a municipality in the Uckermark district, in Brandenburg, Germany.
History
The municipality of Hohenselchow-Groß Pinnow was formed in 2003 as an amalgamation of the municipalities of Hohenselchow and Groß Pinnow. From 1648 to 1720, the constituent localities of Hohenselchow-Groß Pinnow were part of Swedish Pomerania. From 1720 to 1945, they were part of the Prussian Province of Pomerania, from 1945 to 1952 of the State of Mecklenburg-Vorpommern, from 1952 to 1990 of the Bezirk Frankfurt of East Germany and since 1990 of Brandenburg.
Demography
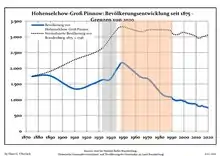
Development of Population since 1875 within the Current Boundaries (Blue Line: Population; Dotted Line: Comparison to Population Development of Brandenburg state; Grey Background: Time of Nazi rule; Red Background: Time of Communist rule)
|
|
|
References
- ↑ Landkreis Uckermark Wahl der Bürgermeisterin / des Bürgermeisters, accessed 4 July 2021.
- ↑ "Bevölkerungsentwicklung und Flächen der kreisfreien Städte, Landkreise und Gemeinden im Land Brandenburg 2021" (PDF). Amt für Statistik Berlin-Brandenburg (in German). June 2022.
- ↑ Detailed data sources are to be found in the Wikimedia Commons.Population Projection Brandenburg at Wikimedia Commons
Towns and municipalities in Uckermark | ||
|---|---|---|
| Coat of Arms of Uckermark district | |
Wikimedia Commons has media related to Hohenselchow-Groß Pinnow.
This article is issued from Wikipedia. The text is licensed under Creative Commons - Attribution - Sharealike. Additional terms may apply for the media files.