Omitlán de Juárez | |
|---|---|
Municipality and town | |
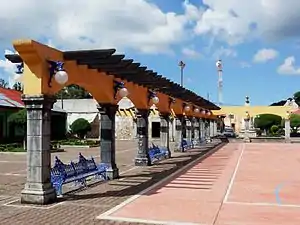 Going from Pachuca to Huasca de Ocampo, you will find Omitlán, a picturesque town. | |
 Seal | |
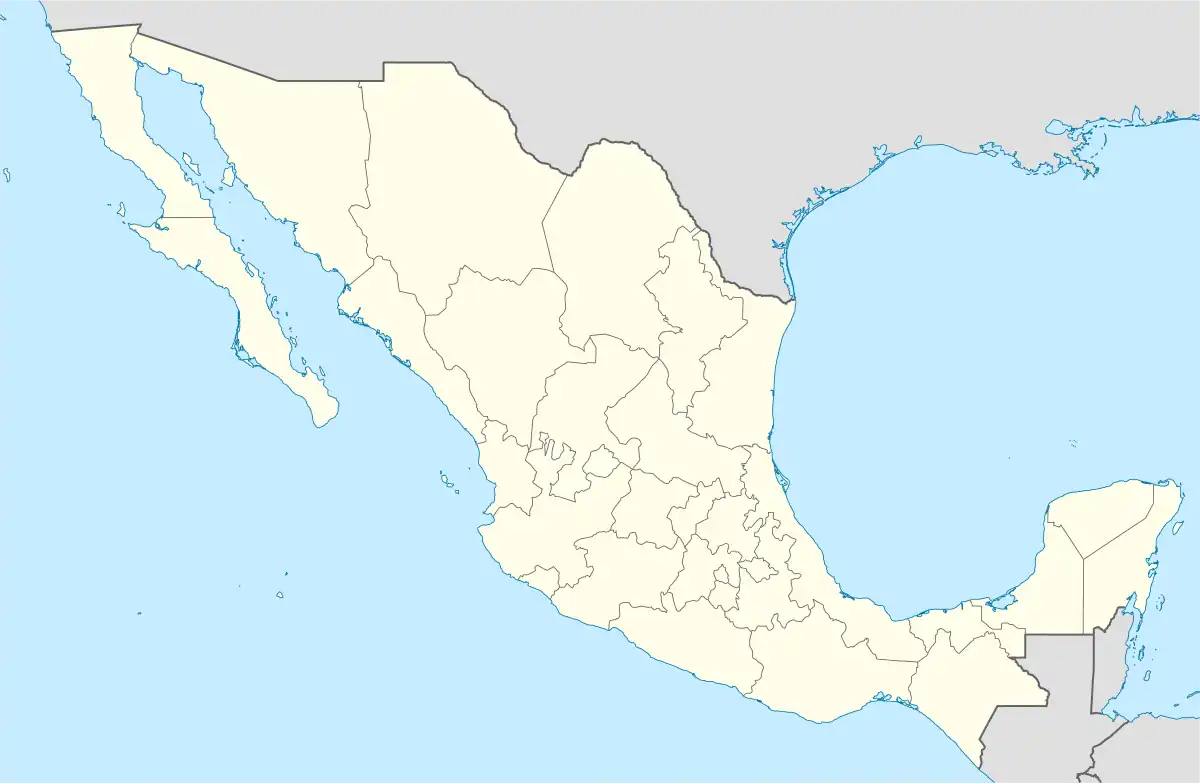 Omitlán de Juárez Location in Mexico | |
| Coordinates: 20°10′11″N 98°38′52″W / 20.16972°N 98.64778°W | |
| Country | |
| State | Hidalgo |
| Municipal seat | Omitlán de Juárez |
| Area | |
| • Total | 110.5 km2 (42.7 sq mi) |
| Population (2005) | |
| • Total | 7,529 |
Omitlán de Juárez is a town and one of the 84 municipalities of Hidalgo, in central-eastern Mexico. The municipality covers an area of 110.5 km².
As of 2005, the municipality had a total population of 7,529.[1]
Toponymy
The name Omitlán in the Nahuatl language means Ome 'two' and tlan 'place', so it is understood that it means Place of two. [note 1][2][3] The surname de Juárez was given to him by the former president of Mexico, Benito Juárez García.[3]
Geography
Relief and hydrology
As for physiography it is located within the province of the Neovolcanic Axis; within the subprovince of Plains and Sierras of Querétaro and Hidalgo.[4] Its territory is sierra (81.0%) and plain (19.0%).[4] The hills known as Cerro Gordo, Cerro del Gallo and Peña del Zumate stand out.[5][6]
As for its geology, it corresponds to the Neogene period (98.23%).[4] With extrusive igneous rocks: intermediate volcanic breccia andesite (53.23%), acid tuff (27.0%), acid tuff, acid volcanic breccia (7.0%) and basalt (11.0%).[4] Regarding soil science the dominant soil is phaeozem (72.23%), luvisol (17.0%) and regosol (9.0%).[4]
With regard to hydrology, it is positioned in the hydrological region of the Pánuco; in the basins of the Moctezuma River; within the sub-basins of the Amajac River (51.0%) and Metztitlán River (49.0%).[4] It has the Amajac and Bandola rivers, the latter of which flows into the Los Angeles Dam. It has two bodies of water.[5][6]
Weather
The municipal territory is found in the following climates with their respective percentage: Temperate sub-humid with rainfall in summer, more humid (92.0%) and semi-cold sub-humid with rains in summer, more humid (8.0%).[4] With an average annual temperature of 14 °C and an annual rainfall of 700 to 1200 millimeters.[5][6]
Ecology
The flora in the municipality is made up of oak, prickly pear, oyamel, ash, pine, walnut, quebrancha, tepozán, strawberry tree, as well as trees such as peach, pear, plum, blackberry, apple, etc.[5][6] The fauna includes animals such as foxes, crows, squirrels, gophers, rattlesnakes, ouncers and a wide variety of songbirds, as well as insects and arachnids of different species.[5][6]
Demographics
Population
| Demographic evolution of the municipality of Omitlán de Juárez. | |
|---|---|
| Año | Población |
| 1995 | 6498 |
| 2000 | 8022 |
| 2005 | 7529 |
| 2010 | 8963 |
| 2015 | 9636 |
| 2020 | 9295 |
| Spring: INEGI. | |
According to the results presented by the 2020 Population and Housing Census of INEGI, the municipality has a total of 9295 inhabitants, 4422 men and 4873 women.[7][8] It has a density of 116.6 inhabitants/km², half of the population is 29 years old or younger, there are 90 males for every 100 females.[8]
The percentage of the population that speaks indigenous language is 0.31%,[note 2] considers itself Afro-Mexican or Afro-descendant is 0.22%.[9] It has a Literacy rate of 99.4% in the population aged 15 to 24, and 92.1% in the population aged 25 and over.[10] The percentage of population by level of schooling,.[note 3] It is 5.5% without schooling, 65.2% with basic education, 20.5% with upper secondary education, 8.7% with higher education, and 0.1% unspecified.[8]
The percentage of the population affiliated with health services is 62.3%. [note 4] 27.3% are affiliated with the IMSS, 66.2% with INSABI, 5.8% with the ISSSTE, 0.4% with IMSS Bienestar, 0.1% with the health units of PEMEX, Defense or Navy, 1.1% to a private institution, and 0.1% to another institution.[10] The percentage of the population with a disability is 5.1%.[9] The percentage of population by marital status,.[note 5] 30.2% are married, 31.9% single, 26.4% are in common-law unions, 5.0% are separated, 1.2% are divorced, 5.3% are widowed.[8]
For 2020, the total number of inhabited private homes is 2506 homes, representing 0.3% of the state total.[8] With an average number of occupants per dwelling of 3.2 people.[8] Houses with partition and block walls predominate.[11] In the municipality, for the year 2020, the electric power service covers a coverage of 99.4%; piped water service by 52.1%; drainage service covers 89.7%; and the health service by 91.9%.[8][12]
Locations
For the year 2020, according to the Catalog of Localities, the municipality has 32 localities.[13]
| INEGI code | Localities | Population (2020)[14] |
Porcentage (%)[nota 1] | Population Area [nota 2] | Population Category [nota 3] |
|---|---|---|---|---|---|
| 130450022 | San Antonio el Paso | 1,260 | 13.56 | Rural | Community |
| 130450001 | Omitlán de Juárez | 1,050 | 11.30 | Urban | Cabecera municipal |
| 130450029 | Venta de Guadalupe | 848 | 9.12 | Rural | Community |
| 130450028 | Velasco | 553 | 5.95 | Rural | Community |
| 130450019 | Puentecillas | 452 | 4.86 | Rural | Settlement |
| 130450021 | Rincón Chico | 433 | 4.66 | Rural | Settlement |
| 130450020 | Ignacio López Rayón | 375 | 4.03 | Rural | Settlement |
| 130450011 | Cruz de Omitlán | 363 | 3.91 | Rural | Settlement |
| 130450030 | El Mirador (La Coyotera) | 332 | 3.57 | Rural | Settlement |
| 130450018 | El Perico | 316 | 3.40 | Rural | Settlement |
| 130450009 | El Comanche | 287 | 3.09 | Rural | Settlement |
| 130450012 | Vicente Guerrero | 281 | 3.02 | Rural | Settlement |
| 130450016 | Morelos | 253 | 2.72 | Rural | Settlement |
| 130450043 | Los Tapancos | 251 | 2.70 | Rural | Settlement |
| 130450023 | Santa Elena | 234 | 2.52 | Rural | Settlement |
| 130450027 | Tres Cañadas | 233 | 2.51 | Rural | Settlement |
| 130450015 | Mixquiapan | 215 | 2.31 | Rural | Settlement |
| 130450006 | Cerro Gordo | 185 | 1.99 | Rural | Settlement |
| 130450014 | Manuel Teniente (El Llano) | 185 | 1.99 | Rural | Settlement |
| 130450035 | El Crucero de Huasca | 180 | 1.94 | Rural | Settlement |
| 130450010 | Cruz de Mujer | 162 | 1.74 | Rural | Settlement |
| 130450005 | El Capulín | 122 | 1.31 | Rural | Settlement |
| 130450013 | Lagunilla | 121 | 1.30 | Rural | Settlement |
| 130450032 | Cuchilalpan | 117 | 1.26 | Rural | Settlement |
| 130450039 | El Resbalón | 107 | 1.15 | Rural | Settlement |
| 130450026 | El Tejocote | 102 | 1.10 | Rural | Settlement |
| 130450002 | Agua Fría | 101 | 1.09 | Rural | Settlement |
| 130450031 | Las Palomas | 65 | 0.70 | Rural | Settlement |
| 130450008 | Ciénega Grande | 49 | 0.53 | Rural | Settlement |
| 130450041 | El Manzano | 39 | 0.42 | Rural | Settlement |
| 130450007 | Ciénega Chica | 15 | 0.16 | Rural | Settlement |
| 130450040 | Agua Escondida | 9 | 0.10 | Rural | Settlement |
Politics
It was erected as a municipality on August 8, 1865.[18][19][20] The Honorable City Council is composed of: a Municipal President, a Syndic, eight Councilors, four Commissions, twenty-four Municipal Delegates and five Ejido Commissariats.[5][6][3] According to the National Electoral Institute (INE) the municipality is made up of ten electoral sections, from A 0812 to 0821.[21] For the election of federal deputies to the Chamber of Deputies of Mexico and local deputies to the Congress of Hidalgo, the III Federal Electoral District of Hidalgo and the IX Local Electoral District of Hidalgo are integrated.[21][22][23] A state administrative level belongs to Macroregion I and Microregion V, as well as to Operational Region I Pachuca.[24]
Chronology of municipal presidents
| Period | Name[5][25] | Political affiliation[5][25] |
|---|---|---|
| 1964-1967 | David Manning Esquivel | - |
| 1967-1970 | Rubén López Cerón | - |
| 1970-1973 | J. Félix Melgarejo Anaya | - |
| 1973-1976 | Alberto Rivera Vázquez | - |
| 1976-1979 | Jose A. Vivar Sanchez | - |
| 1979-1982 | José Manning Bustamante | - |
| 1982-1985 | José de Jesús Rogelio Melgarejo Amador | - |
| 1985-1988 | Jorge Alvarado Arista | - |
| 1988-1991 | José Calderón Mancilla | - |
| 1991-1994 | Carolina Patricia Borbolla Calderón | - |
| 16/01/1994 to 15/01/1997 |
Fermín Laurel Cabrera Arista | |
| 16/01/1997 to 15/01/2000 |
Irais García Samperio | |
| 16/01/2000 to 15/01/2003 |
José Calderón Mancilla | |
| 16/01/2003 to 15/01/2006 |
José Antonio Pérez Anaya | |
| 16/01/2006 to 15/01/2009 |
José Luis Ordaz Ríos | |
| 16/01/2009 to 15/01/2012 |
Gerardo Manuel Arcega Domínguez | Mas x Hidalgo |
| 16/01/2012 to 04/09/2016 |
Juan Carlos Zarco Cruz | Together for Hidalgo |
| 05/09/2016 to 18/01/2017 |
Rubén Martín López García | Interim City Council[note 6] |
| 19/02/2017 to 04/09/2020 |
Ulises Hernández Vázquez | |
| 05/09/2020 to 14/12/2020 |
Juan Carlos Zarco Cruz | Interim City Council[note 8] |
| 15/12/2020 to 04/09/2024 |
Jorge Martín Borbolla Calderón |
Economy
In 2015 the municipality had an HDI of 0.701 High, so ranks 45th at the state level;[26] and in 2005 it had a GDP of $326,367,496.00 and a GDP per capita of $43,348.00 (current 2005 prices).[27][25]
According to the National Council for the Evaluation of Social Development Policy (Coneval), the municipality registers a Marginalization Index Medium.[12] 47.5% of the population is in moderate poverty and 15.1% is in extreme poverty.[12] In 2015, the municipality ranked 43rd out of 84 municipalities in the state scale of social backwardness.[28]
As of 2015 data, in terms of agriculture, in this municipality it is mostly corn grain and forage oats, and although in a smaller proportion apples, peaches and barley grain are planted.[6][12] In livestock the majority of livestock production is sheep and poultry and to a lesser extent goats.[6][12]
As of 2015, there are 113 economic units, which generated jobs for 146 people.[12] As far as commerce is concerned, there are two tianguis, seven Diconsa stores, and one Liconsa store; as well as a municipal market, and a municipal flea market.[12] According to figures for the year 2015 presented in the Economic Censuses by INEGI, the Economically Active Population (EAP) of the municipality amounts to 3280 of which 3098 are employed and 182 are unemployed. [note 9][12] 16.30% belong to the primary sector, 33.63% belong to the secondary sector, 49.80% belong to the tertiary sector and 0.27% did not specify.
References
Notes
- ↑ The etymological origin of the name of a municipality can have various interpretations or have an uncertain origin, this is the most common or most accepted by the municipal government and its inhabitants, according to the Encyclopedia of the Municipalities of Mexico.
- ↑ Percentage of population aged 3 years and over. and the percentage of the population that
- ↑ Percentage of population aged 15 and over
- ↑ Includes multiple affiliations.
- ↑ Percentage of population aged 12 and over
- ↑ The 2016 Hidalgo State Elections were declared null and void
- ↑ Winner of the 2016 Hidalgo Special State Election
- ↑ Due to the postponement of the 2020 Hidalgo State Election, due to the COVID-19 pandemic; Interim Municipal Councils are appointed. Alejandro, Reyes (May 15, 2020). "Possibility of implementing Municipal Councils due to suspension of elections". Milenio Diario. Retrieved November 4, 2020.Teodoro, Santos (June 26, 2020). "Municipal Councils, citizens in power in 84 municipalities". Milenio Diario. Retrieved September 5, 2020.
- ↑ Size of the community according to the number of inhabitants for the population aged 12 years and over.
- ↑ Porcentaje respecto al total municipal; la suma podría variar del 100 % por el redondeo de decimales.
- ↑ De acuerdo al INEGI, se considera una localidad rural con una población menor a 2500 habitantes; y una localidad urbana con mayor o igual a 2500 habitantes; la cabecera municipal se considera urbana sin importar su población.[15][16]
- ↑ De acuerdo a la Ley orgánica municipal del estado de Hidalgo se considera una ciudad a las que tengan más de 25 000 habitantes; pueblo, más de 10 000 habitantes; villa, más de 5000 habitantes; comunidad, más de 500 habitantes; y ranchería, las que tengan menos de 500 habitantes.[17]
References
- ↑ "Omitlán de Juárez". Enciclopedia de los Municipios de México. Instituto Nacional para el Federalismo y el Desarrollo Municipal. Retrieved December 27, 2008.
- ↑ Centro Estatal de Estudios Municipales del Estado de Hidalgo (1988). Los Municipios de Hidalgo. Colección Enciclopedia de los municipios de México. Secretaría de Gobernación.
- 1 2 3 "Omitlán de Juárez". Municipios de Hidalgo. Gobierno del estado de Hidalgo. Archived from the original on 14 April 2017. Retrieved 22 March 2017.
- 1 2 3 4 5 6 7
- 1 2 3 4 5 6 7 8
- 1 2 3 4 5 6 7 8
- ↑ Instituto Nacional de Estadística y Geografía (2020). "Principales resultados por localidad (ITER). Hidalgo". Retrieved 25 January 2021.
- 1 2 3 4 5 6 7 INEGI (2021). Panorama sociodemográfico de Hidalgo. Censo de Población y Vivienda 2020 (PDF). Instituto Nacional de Estadística y Geografía. Retrieved 20 March 2021.
- 1 2
- 1 2
- ↑ Sistema Integral de Información del Estado de Hidalgo. "Información Estadística Básica: Carpeta Municipal Omitlán de Juárez" (PDF). Secretaria de Planeación Desarrollo Regional Regional y Metropolitano. Gobierno del estado de Hidalgo. Archived from the original (PDF) on 30 December 2017. Retrieved 22 March 2017.
- 1 2 3 4 5 6 7 8
- ↑ Catálogo Localidades - Microrregiones. "Municipio de Omitlán de Juárez". Secretaría de Desarrollo Social. Gobierno de México. Retrieved 22 March 2017.
- ↑ Instituto Nacional de Estadística y Geografía (2020). "Principales resultados por localidad (ITER). Hidalgo". Retrieved 25 January 2021.
- ↑ Cervera Flores, Miguel; Rangel González, J. Walter (February 2015). "Distribución de la Población por Tamaño de Localidad y su Relación con el Medio Ambiente" (PDF). Definición de localidad y determinación de rangos de tamaño. Instituto Nacional de Estadística y Geografía. Retrieved 3 December 2016.
- ↑ INEGI. "Manual de cartografía geoestadística" (PDF). Instituto Nacional de Estadística y Geografía. Retrieved 2 December 2015.
- ↑ "Ley orgánica municipal del estado de Hidalgo" (PDF). Gobierno del estado de Hidalgo. 16 April 2001. Retrieved 22 March 2017.
- ↑ INEGI (1997). División territorial del estado de Hidalgo de 1810 a 1995 (PDF) (Primera ed.). Aguascalientes, Aguascalientes: Instituto Nacional de Estadística y Geografía. pp. 81–92. Retrieved 25 April 2018.
- ↑ Menes Llaguno, Juan Manuel [in Spanish] (2007). Historia de las divisiones territoriales de los municipios del Estado de Hidalgo (Primera ed.). Pachuca, México: Instituto de Estudios Legislativos del Congreso de Hidalgo. p. 14. Retrieved 10 September 2020.
- ↑ Instituto Nacional para el Federalismo y el Desarrollo Municipal. "Enciclopedia de los Municipios y Delegaciones de México: Gobierno del estado de Hidalgo". Secretaría de Gobernación. Gobierno de México. Archived from the original on 21 March 2018. Retrieved 22 March 2017.
- 1 2 INE (15 March 2017). "Descriptivo de la distritacion federal de Hidalgo" (PDF). Instituto Nacional Electoral. Retrieved 8 March 2018.
- ↑ INE (15 March 2017). "Distritos Electorales Federales de Hidalgo" (PDF). Instituto Nacional Electoral. Retrieved 8 March 2018.
- ↑ INE (15 March 2017). "Distritos Electorales Loales de Hidalgo" (PDF). Instituto Nacional Electoral. Retrieved 8 March 2018.
- ↑ Congreso del estado de Hidalgo (25 December 2017). "Decreto que determina la regionalización del Estado Libre y Soberano de Hidalgo" (PDF). Periódico Oficial del Estado de Hidalgo. Gobierno del estado de Hidalgo. Archived from the original (PDF) on 22 July 2019. Retrieved 26 February 2018.
- 1 2 3 Instituto Nacional para el Federalismo y el Desarrollo Municipal. "Sistema Nacional de Información Municipal". Secretaría de Gobernación. Gobierno de México. Retrieved 3 March 2017. To view information, first select the type of information you want, then the state of Hidalgo in the "Federative entity" field, and then choose in the "municipality" field.
- ↑ COESPO (2019). "Hidalgo. Índice de Desarrollo Humano Municipal 2015" (PDF). Consejo Estatal de Población. Gobierno del estado de Hidalgo. Retrieved 22 July 2019.
- ↑ "Hidalgo. Indicadores sociodemográficos e índices de dedesarrollo humano por municipio, 2000 y 2005" (PDF). Consejo Estatal de Población. Gobierno del estado de Hidalgo. 2005. Archived from the original (PDF) on 8 December 2015. Retrieved 22 March 2017.
- ↑ Coneval. "Informe Annual Report on the Situation of Poverty and Social Backwardness: Omitlán de Juárez, Hidalgo (2017)" (PDF). Ministry of Social Development. Government of Mexico. Retrieved March 3, 2017.
{{cite web}}:|author=has generic name (help)
