5

I am plotting the creation times of a large batch of files in gnuplot to see if they are created linearly in time (they are not).

Here is my code:

#!/bin/bash

stat -c %Y img2/*png > timedata

echo "set terminal postscript enhanced colour
set output 'file_creation_time.eps'
plot 'timedata'" | gnuplot

The problem I have is that the y data are the creation time in seconds since unix start time, so the plot just has 1.333...e+09 on the y-axis. I would like to have the creation time of the first file scaled to zero so that the relative creation times are readable.

I encounter this problem in a number of data-plotting contexts, so I would like to be able to do this within gnuplot rather than resorting to awk or some utility to preprocess the data.

I know the first time will be the smallest since the files are named serially, so is there a way to access the first element in a file, something like

`plot 'data' using ($1-$1[firstelement])`

?
andyras
  • 15,542
  • 6
  • 55
  • 77
  • This is nearly the same question as one I had some time ago, so I'm just linking it here: [Reading dataset value into a gnuplot variable (start of X series)](http://stackoverflow.com/questions/7540614/reading-dataset-value-into-a-gnuplot-variable-start-of-x-series)... Cheers! – sdaau Oct 27 '12 at 15:28

3 Answers3

5

I think you can do something like that...(the following is untested, but I think it should work...). Basically, you have to plot the file twice -- the first time through gnuplot picks up statistics about the dataset. The second time through, you use what you found on the first run-through to plot what you actually want.

set terminal unknown
plot 'datafile' using 1:2
set terminal post enh eps color
set output 'myfile.eps'
YMIN=GPVAL_Y_MIN
plot '' u 1:($2-YMIN)

If you have gnuplot 4.6, you can do the same thing with the stats command. http://www.gnuplot.info/demo/stats.html

EDIT It appears you want the first point to provide the offset (sorry, misread the question)...

If you want the first point to provide the offset, you may be able to do something like (again, untested -- requires gnuplot >= 4.3):

first=0;
offset=0;
func(x)=(offset=(first==0)?x:offset,first=1,x-offset)
plot 'datafile' using (func($1))
mgilson
  • 300,191
  • 65
  • 633
  • 696
1

Gnuplot accepts unix commands, so you can say something like

gnuplot> plot "< tail -3 test.dat" using 1:2 with lines

in order to plot just the last three lines. You can use something like this for your purpose. Moreover, if you want to plot let's say from line 1000 to 2000

plot "<(sed -n '1000,2000p' filename.txt)" using 1:2 with lines 

You can check this website, for more examples.

jkt
  • 2,538
  • 3
  • 26
  • 28
  • 1
    This doesn't quite answer the question I have--I want to subtract a constant value from each value in a column. I will try to exploit the ability of gnuplot to execute UNIX commands, though. – andyras Apr 05 '12 at 23:23
  • @AndyRasmussen Maybe you can store the lowest value in a variable, and use `using ($1-$var)` – Bernhard Apr 06 '12 at 08:32
  • @Bernhard I think the question is how do you find the value of `$var` (and in gnuplot, it is just `var` not `$var` -- I think `$var` will give you the value in the `var` column of data... – mgilson Apr 06 '12 at 12:04
  • You are right, only I don't know how it is done. Can you hane files into variables as you do with plotting? – Bernhard Apr 06 '12 at 12:34
  • @Bernhard Yes, when gnuplot plots something, it does some basic information gathering -- the trick is to plot to a Null terminal, and then use the info gnuplot gathered. (see my answer above). – mgilson Apr 06 '12 at 15:45
0

I found a related stackoverflow question here and exploited the awk script from one of the answers:

#!/bin/bash

stat -c %Y img2/*png > timedata

echo "set terminal postscript enhanced colour
set output 'file_creation_time.eps'
unset key
set xlabel 'file number'
set ylabel 'file creation time (after first)'
plot \"<awk '{if(NR==1) {shift = \$1} print (\$1 - shift)}' timedata\"" | gnuplot

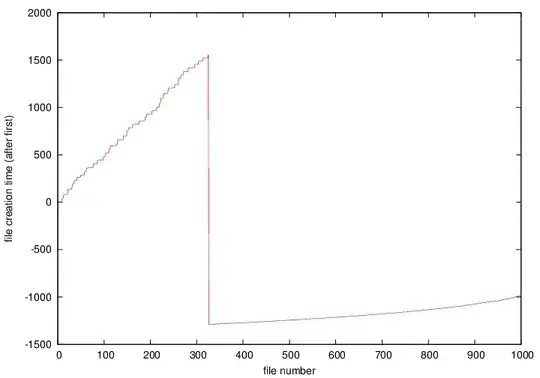
The output looks like this (these are not the data I was talking about in my question, but similar): enter image description here

So, gnuplot can do what I want but it does depend on the UNIX environment...

I also tried mgilson's method:

plot 'timedata'
YMIN=GPVAL_Y_MIN
plot '' u ($1-YMIN)

but gnuplot (my version is 4.4.2) did not find the minimum correctly. It came close; it looks like it plotted such that the minimum of the y range is 0: enter image description here

Community
  • 1
  • 1
andyras
  • 15,542
  • 6
  • 55
  • 77
  • Oh, you wanted the first point to provide the offset. I see now. – mgilson Apr 06 '12 at 15:48
  • I've posted an updated answer that doesn't rely on POSIX compatability -- though I haven't tested it. I would be interested to know if it works though (it uses a feature that I haven't spent much time with in gnuplot 4.4) – mgilson Apr 06 '12 at 15:54