I'm using the JFreechat API to draw an XYAreaChart with a TimeSeriesCollection dataset. The values I'm putting in the dataset are variables with no limit: they can go from 0 to more than 1000. The problem here is that I want to make the ValueAxis automatically fit the data.
I have tried to use :
    XYPlot plot = mychart.getXYPlot();
    ValueAxis axis = plot.getDomainAxis();
    axis.setAutoRange(true);
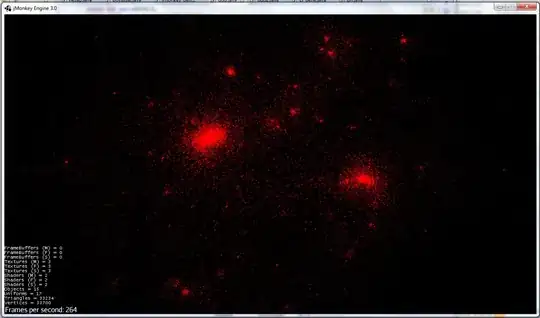
I see that with setAutoRange, it is not so "automatically." It's true that it changes the axis when the plot gets big values, but it doesn't re-size the axis when there is no more big data as shown here:


I want that the axis Range gets back to fit the biggest value shown (~400 in this example) because it becomes hard to read the little values with this range without using zoom. Is that possible?