38

I'm trying to modify an example of a simple forest plot by introducing facets according to a factor variable.

Assuming data of this structure:

test <- structure(list(characteristic = structure(c(1L, 2L, 3L, 1L, 2L
), .Label = c("Factor1", "Factor2", "Factor3"), class = "factor"), 
    es = c(1.2, 1.4, 1.6, 1.3, 1.5), ci_low = c(1.1, 1.3, 1.5, 
    1.2, 1.4), ci_upp = c(1.3, 1.5, 1.7, 1.4, 1.6), label = structure(c(1L, 
    3L, 5L, 2L, 4L), .Label = c("1.2 (1.1, 1.3)", "1.3 (1.2, 1.4)", 
    "1.4 (1.3, 1.5)", "1.5 (1.4, 1.6)", "1.6 (1.5, 1.7)"), class = "factor"), 
    set = structure(c(1L, 1L, 1L, 2L, 2L), .Label = c("H", "S"
    ), class = "factor")), .Names = c("characteristic", "es", 
"ci_low", "ci_upp", "label", "set"), class = "data.frame", row.names = c(NA, 
-5L))

And running the code:

p <- ggplot(test, aes(x=characteristic, y=es, ymin=ci_low, ymax=ci_upp)) + geom_pointrange() +
  coord_flip() + geom_hline(aes(x=0), lty=2) + 
  facet_wrap(~ set, ncol = 1) +
  theme_bw() + 
  opts(strip.text.x = theme_text())

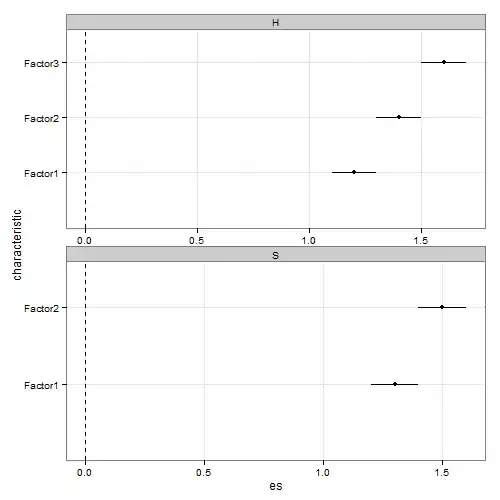
Produces output like that:

enter image description here

All good so far. However, I'd like to get rid of empty Factor3 level from my lower panel and cannot find a way to do that. Is there any way to do that?

Thanks for help.

Tyler Rinker
  • 108,132
  • 65
  • 322
  • 519
radek
  • 7,240
  • 8
  • 58
  • 83
  • 5
    When referencing R I stopped asking "Is there..." and started asking "How can I..." `install.packages("fortunes"); library(fortunes); fortune("Yoda")` – Tyler Rinker Apr 17 '12 at 00:16

2 Answers2

35

EDIT Updated to ggplot2 0.9.3

Here's another solution. It uses facet_grid and space = "free"; also it uses geom_point() and geom_errorbarh(), and thus there is no need for coord.flip(). Also, the x-axis tick mark labels appear on the lower panel only. In the code below, the theme command is not essential - it is used to rotate the strip text to appear horizontally. Using the test dataframe from above, the following code should produce what you want:

library(ggplot2)

p <- ggplot(test, aes(y = characteristic, x = es, xmin = ci_low, xmax = ci_upp)) +
   geom_point() +
   geom_errorbarh(height = 0) +
   facet_grid(set ~ ., scales = "free", space = "free") +
   theme_bw() +
   theme(strip.text.y = element_text(angle = 0))

p

The solution is based on the example on page 124 in Wickham's ggplot2 book.

Sandy Muspratt
  • 31,719
  • 12
  • 116
  • 122
28

Use scales = "free" as in:

p <- ggplot(test, aes(x=characteristic, y=es, ymin=ci_low, ymax=ci_upp)) + geom_pointrange() +
  coord_flip() + geom_hline(aes(x=0), lty=2) + 
  facet_wrap(~ set, ncol = 1, scales="free") +
  theme_bw() + 
  opts(strip.text.x = theme_text())

p

Which produces:

enter image description here

EDIT: I actually think I like the drop = TRUE argument better for this solution as in:

p <- ggplot(test, aes(x=characteristic, y=es, ymin=ci_low, ymax=ci_upp)) + 
  geom_pointrange() +
  coord_flip() + geom_hline(aes(x=0), lty=2) + 
  facet_wrap(~ set, ncol = 1,  drop=TRUE) +
  theme_bw() + 
  opts(strip.text.x = theme_text())

p
Axeman
  • 32,068
  • 8
  • 81
  • 94
Tyler Rinker
  • 108,132
  • 65
  • 322
  • 519
  • Excellent! Worked as a charm. One question though: Will panels always be of a proportionate size (vertically)? Is there.. Not - How can I scale them according to the number of factors used by each? For instance - if I have 10 in upper panel, and 3 in lower? – radek Apr 17 '12 at 00:40
  • 6
    I think `space = "free"` is the other argument you're looking for. – Tyler Rinker Apr 17 '12 at 02:08
  • I think `space = "free"` argument is for [facet_grid](http://had.co.nz/ggplot2/facet_grid.html). However `scales = 'free_x'` doesn't work any longer there :/ – radek Apr 18 '12 at 12:22
  • 6
    How can this be done with out causing the scale of the axis to expand? In this example notice the space between the Factor1 and Factor 2 gridline is different between the top and bottom. It's not so noticeable here but when creating a stacked barchart, the widths of the bars will now be much different between the facet panels depending on how many factors in the axis get dropped. This one has me stumped. Any ideas? – mindless.panda Jul 02 '12 at 21:12
  • Just a note that drop = TRUE did not work for me, but scales = TRUE did. Probably could be related to some specifics of my code. – Brandon May 28 '15 at 05:13