34

I'm using Python to simulate a process that takes place on directed graphs. I would like to produce an animation of this process.

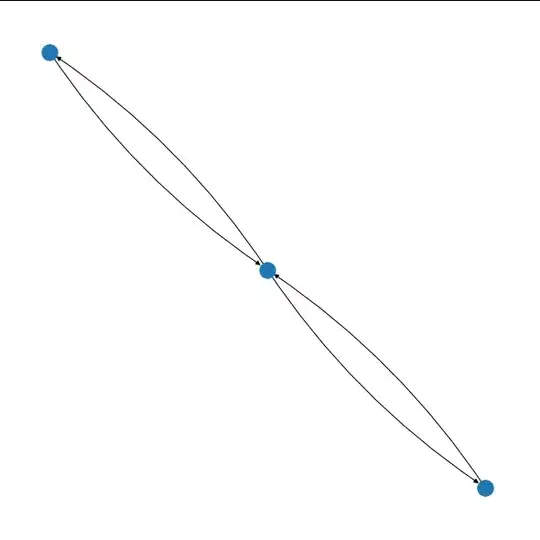
The problem that I've run into is that most Python graph visualization libraries combine pairs of directed edges into a single edge. For example, NetworkX draws only two edges when displaying the following graph, whereas I would like to display each of the four edges separately:

import networkx as nx
import matplotlib.pyplot as plt 

G = nx.MultiDiGraph()

G.add_edges_from([
    (1, 2),
    (2, 3),
    (3, 2),
    (2, 1),
])

plt.figure(figsize=(8,8))
nx.draw(G)
Output from NetworkX; parallel edges are overlapping, so only two lines are displayed

I would like to display something like this, with each parallel edge drawn separately:

Desired output format; parallel edges are drawn separately

The question R reciprocal edges in igraph in R seems to deal with the same issue, but the solution there is for the R igraph library, not the Python one.

Is there an easy way to produce this style of plot using an existing Python graph visualization library? It would be a bonus if it could support multigraphs.

I'm open to solutions that invoke an external program to produce the images. I'd like to generate a whole series of animation frames, so the solution must be automated.
Lee
  • 29,398
  • 28
  • 117
  • 170
Josh Rosen
  • 13,511
  • 6
  • 58
  • 70
  • Related http://stackoverflow.com/questions/15053686/networkx-overlapping-edges-when-visualizing-multigraph – 0 _ Jul 23 '13 at 22:43

4 Answers4

34

The Graphviz tools appear to display distinct edges.

For example, giving this:

digraph G {
  A -> B;
  A -> B;
  A -> B;
  B -> C;

  B -> A;
  C -> B;
}

to dot produces:

example graph

Graphviz's input language is pretty simple so you can generate it on your own, though searching for "python graphviz" does turn up a couple of libraries including a graphviz module on PyPI.

Here's python that generates the above graph using the graphviz module:

from graphviz import Digraph

dot = Digraph()
dot.node('A', 'A')
dot.node('B', 'B')
dot.node('C', 'C')
dot.edges(['AB', 'AB', 'AB', 'BC', 'BA', 'CB'])

print(dot.source)
dot.render(view=True)
Thomas Ahle
  • 30,774
  • 21
  • 92
  • 114
Laurence Gonsalves
  • 137,896
  • 35
  • 246
  • 299
  • 3
    It turns out that NetworkX can [export .dot files using pydot](http://networkx.lanl.gov/reference/drawing.html#module-networkx.drawing.nx_pydot) or [pygraphviz](http://networkx.lanl.gov/reference/drawing.html#module-networkx.drawing.nx_agraph), so this works perfectly. Thanks! – Josh Rosen May 02 '12 at 19:20
  • Both links are dead @JoshRosen – alper May 02 '19 at 11:08
  • I am having following error: `Format: "pdf" not recognized. Use one of`@Laurence Gonsalves – alper May 02 '19 at 11:33
  • @alper I believe it's possible to select the output formats at build time. You may need to install a different distribution of graphviz, or build your own. – Laurence Gonsalves May 06 '19 at 20:33
17

Maybe I am a little late but I found another solution to you issue. I am posting it so that it can be helpful if somebody has the same problem.

It is possible to plot directed graphs with networkx using matplotlib in a way that the edges appear separately, by passing the argument connectionstyle to the function networkx.drawing.nx_pylab.draw:

import matplotlib.pyplot as plt
import networkx as nx


# create a directed multi-graph
G = nx.MultiDiGraph()
G.add_edges_from([
    (1, 2),
    (2, 3),
    (3, 2),
    (2, 1),
])
# plot the graph
plt.figure(figsize=(8,8))
nx.draw(G, connectionstyle='arc3, rad = 0.1')
plt.show()  # pause before exiting

Here you see the result:

The result

See also the documentation of matplotlib.patches.ConnectionStyle about the argument connectionstyle.

0 _
  • 10,524
  • 11
  • 77
  • 109
AMangipinto
  • 521
  • 5
  • 7
  • This seems to make arcs even for vertices connected with a single directed edge. Is there any easy workaround for that? – Mehdi Saffar Sep 29 '22 at 22:00
13

Using NetworkX, a possible workaround which avoids file I/O and uses dot via pydot for layout is:

import networkx as nx
import matplotlib.pyplot as plt
import matplotlib.image as mpimg
from io import BytesIO

g = nx.dodecahedral_graph()
d = nx.drawing.nx_pydot.to_pydot(g)
    # `d` is a `pydot` graph object,
    # `dot` options can be easily set
    # attributes get converted from `networkx`,
    # use set methods to control
    # `dot` attributes after creation
png_str = d.create_png()
sio = BytesIO() # file-like string, appropriate for imread below
sio.write(png_str)
sio.seek(0)
img = mpimg.imread(sio)
imgplot = plt.imshow(img)
plt.show()  # added to make the script wait before exiting

for why seek(0) is needed, see How to create an image from a string in python

If within the IPython (qt)console, then the above will print inline and a more direct approach is:

import networkx as nx
from IPython.display import Image

g = nx.dodecahedral_graph()
d = nx.drawing.nx_pydot.to_pydot(g)

png_str = d.create_png()
Image(data=png_str)
0 _
  • 10,524
  • 11
  • 77
  • 109
  • This example needs to be updated: `nx.to_pydot` is no longer available. Instead you should `pip install pydotplus` and then use `nx.drawing.nx_pydot.to_pydot` instead. – ogrisel Jan 26 '17 at 13:59
  • 1
    Thanks for raising the need to update this example, I updated it. `pydotplus` has already been reverted to `pydot` in upstream `networkx`, please see [this PR](https://github.com/networkx/networkx/pull/2272). – 0 _ Jan 26 '17 at 18:21
  • 1
    If pydotplus does not find your `graphviz` instalation it will throw `InvocationException: GraphViz's executables not found`. A workaround is to add it to system path for current execution like this: `import os` then `os.environ["PATH"] += r";C:\Anaconda\envs\testes\Library\bin\graphviz"` where you should replace the folder where your graphviz executables are located. – mvbentes Aug 19 '17 at 23:24
  • `pydotplus` is an unmaintained fork of `pydot`. `pydot == 1.2.3` will look for GraphViz executables only in the `$PATH`, for the reasons described in [this issue](https://github.com/erocarrera/pydot/issues/126#issuecomment-232469905) and issues referenced in it. Adding the relevant paths to the environment's `$PATH` variable isn't a workaround, but the proper way of declaring where GraphViz is located. Please consider using `.bashrc` or an equivalent, instead of modifying `os.environ` at runtime. – 0 _ Aug 20 '17 at 00:25
3

You can do it by using the matplotlib interface:

G=nx.MultiGraph ([(1, 2),
   (2, 3),
   (3, 2),
   (2, 1)])
pos = {1: (0.4,0.5), 2: (0.5,0.5), 3: (0.6,0.5)}
nx.draw_networkx_nodes(G, pos, node_color = 'k', node_size = 100, alpha = 1)
ax = plt.gca()
for e in G.edges:
    ax.annotate("",
                xy=pos[e[0]], xycoords='data',
                xytext=pos[e[1]], textcoords='data',
                arrowprops=dict(arrowstyle="->", color="0.5",
                                shrinkA=5, shrinkB=5,
                                patchA=None, patchB=None,
                                connectionstyle="arc3,rad=rrr".replace('rrr',str(2*(e[2]-0.5))
                                ),
                                ),
                )
plt.axis('off')
plt.show()

enter image description here

Lee
  • 29,398
  • 28
  • 117
  • 170