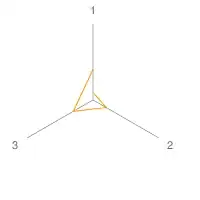
I'm coding iOS app that will explain complex numbers to the user. Complex numbers can be displayed in Cartesian coordinates and that's what I want to do; print one or more vectors on the screen.
I am looking for the easiest way to print 3 vectors into a coordinate system that will adjust itself to the vector-size (if x-coord is > y-coord adjust both axis to x-coord and vice versa).
I tried using Core Plot, which I think is way too multifunctional for my purpose. Right now I am working with PowerPlot and my coordinate system looks okay already, but I still encounter some problems (x- and y-axis are set to the x and y values which results in a 45 degree angled line, no matter the user input).
The functionality of the examples in CorePlot and PowerPlot don't seem to meet my needs.
My last two approaches were using HTML and a web view, and doing it all myself with Quartz (not the simple way...)
Do you have any advice how to do this the simple way, as it is a simple problem, I guess?
