While arguably not as pretty as interpolating H in the HLS or HSV colorspace, a much simpler to implement approach would be to write a function that mapped the single value into three components corresponding to a linearly-interpolated color between completely red (1,0,0) and completely green (0,1,0) in the RGB colorspace.
Here's what I mean:
def pseudocolor(val, minval, maxval):
    """ Convert value in the range minval...maxval to a color between red
        and green.
    """
    f = float(val-minval) / (maxval-minval)
    r, g, b = 1-f, f, 0.
    return r, g, b

if __name__ == '__main__':
    steps = 10
    print('val       R      G      B')
    for val in xrange(0, 100+steps, steps):
        print('{:3d} -> ({:.3f}, {:.3f}, {:.3f})'.format(
                    val, *pseudocolor(val, 0, 100)))
Output:
val       R      G      B
  0 -> (1.000, 0.000, 0.000)
 10 -> (0.900, 0.100, 0.000)
 20 -> (0.800, 0.200, 0.000)
 30 -> (0.700, 0.300, 0.000)
 40 -> (0.600, 0.400, 0.000)
 50 -> (0.500, 0.500, 0.000)
 60 -> (0.400, 0.600, 0.000)
 70 -> (0.300, 0.700, 0.000)
 80 -> (0.200, 0.800, 0.000)
 90 -> (0.100, 0.900, 0.000)
100 -> (0.000, 1.000, 0.000)
You can transform the floating-point r,g,b components as needed, such as to integers in the range of 0..255.
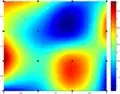
Here's a sample showing what its output looks like:
If you want to go from green to red, just reverse the calculations for r and g in the function. Without too much additional effort, you could generalize the concept to allow linear-interpolation between any two given colors.
Here's how that could be done:
def pseudocolor(val, minval, maxval, startcolor, stopcolor):
    """ Convert value in the range minval...maxval to a color in the range
        startcolor to stopcolor. The colors passed and the the one returned are
        composed of a sequence of N component values.
    """
    f = float(val-minval) / (maxval-minval)
    return tuple(f*(b-a)+a for (a, b) in zip(startcolor, stopcolor))

if __name__ == '__main__':
    YELLOW, BLUE = (1, 1, 0), (0, 0, 1)
    steps = 10

    print('val       R      G      B')
    for val in range(0, 100+steps, steps):
        print('{:3d} -> ({:.3f}, {:.3f}, {:.3f})'.format(
                    val, *pseudocolor(val, 0, 100, YELLOW, BLUE)))
Sample output using the provided colors: