5

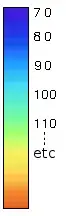
I have a map with a scale like this one: (the numbers are just an example)

Gradient which describes a single variable on a map. However, I don't have access to the original data and know pretty close to nothing about image processing. What I have done is use PIL to get the pixel-coordinates and RGB values of each point on the map. Simply using pix = im.load() and saving pix[x,y] for each x,y. Now I would like to guess the value of each point using the gradient above.

Is there a standard formula for such a gradient? Does it look very familiar to the trained eye? I have visited Digital Library of Mathematical Functions for some examples ... but I'm not sure if it's using the hue, the rgb height function or something else (to make things easier I'm also colorblind to some greens/brows/reds) :)

Any tips on how to proceed, libraries, links or ideas are appreciated. Thank you!

edit:

Following the replies and martineau's suggestion, I've tried to catch the colors at the top and bottom:

def rgb2hls(colotup):
    '''converts 225 based RGB to 360 based HLS
    `input`: (222,98,32) tuple'''

    dec_rgb = [x/255.0 for x in colotup] # use decimal 0.0 - 1.0 notation for RGB
    hsl_col = colorsys.rgb_to_hls(dec_rgb[0], dec_rgb[1], dec_rgb[2])
    # PIL uses hsl(360,x%,y%) notation and throws errors on float, so I use int
    return (int(hsl_col[0]*360), int(hsl_col[1]*100), int(hsl_col[2]*100))


def pil_hsl_string(hsltup):
    '''returns a string PIL can us as HSL color
    from a tuple (x,y,z) -> "hsl(x,y%,z%)"'''
    return 'hsl(%s,%s%%,%s%%)' % (hsltup[0], hsltup[1], hsltup[2])


BottomRed = (222,98,32) # taken with gimp
TopBlue =  (65, 24, 213) 

hue_red = pil_hsl_string(rgb2hls(BottomRed))
hue_blue = pil_hsl_string(rgb2hls(TopBlue))

However they come out pretty different ... which makes me worry about using the rgb_to_hls function to extract the values. Or I'm I doing something very wrong? Here's what the color s convert to with the code: enter image description here

Massagran
  • 1,781
  • 1
  • 20
  • 29

4 Answers4

2

The scale in the image looks like an HSV gradient to me, something like what is mentioned in this question. If so, you could use the colorsys.rgb_to_hls() or colorsys.rgb_to_hsv() functions to obtain a hue color value between 0 and 1 from the r,g,b values in a pixel. That can then be mapped accordingly.

However, short of doing OCR, I have no idea how to determine the range of values being represented unless it's some consistent range you can just hardcode.

Community
  • 1
  • 1
martineau
  • 119,623
  • 25
  • 170
  • 301
2

Interesting question..

If you do a clock-wise walk in HSL color-space from 250,85%,85% --> 21,85%,85% you get a gradient very close to the one you've shown. The obvious difference being that your image exhibits a fairly narrow band of greenish values.

So, if you have the 4 magic numbers then you can interpolate to any point within the map.

These of course being the first and last colour, also the first and last scale value. Here's the image I got with a straight linear gradient on the H channel (used the gimp). enter image description here

EDIT: I've since whipped up a program to grab the pixel values for each row, graphing the results. You can see that indeed, the Hue isn't linear, you can also see the S & V channels taking a definite dip at around 115 (115 pixels from top of image) This indeed corresponds with the green band.

Given the shape of the curves, I'm inclined to think that perhaps they are intended to model something. But don't have the experience in related fields to recognise the shape of the curves.

Below, I've added the graphs for the change in both the HSV and RGB models. The left of the graph represents the top of the bar. The X-axis labels represent pixels

Quite interesting, me thinks. Bookmarked.

enter image description here

enter image description here

enhzflep
  • 12,927
  • 2
  • 32
  • 51
  • very cool! I didn't know this existed or that you could read HSV on the gimp. It also reveals that a clockwise HSV doesn't quite match the gradient. – Massagran Oct 27 '12 at 20:59
  • 1
    @Massagran - yeah, pretty neat huh. Can even get a gimp plugin that makes stereograms, but I digress.. Been thinking some more over this gradient, I think that rather than a single gradient, that they've used 2. 1 from orange to (just getting) greenish. The second from (just ending being) greenish to blue. I reckon 120 on your map corresponds to the join-point. I also reckon that the gradients avoid the section that's shown in my image from ~100 to 130. Knew there had to be a use for this tool/setting combo! – enhzflep Oct 27 '12 at 21:13
  • @enhzlep, now that you mention it zooming in shows that the gradient so to say "accelerates" zoom into this: http://i.imgur.com/aSw93.png and notice that each color doesn't occupy the same width like it does in the gimp gradient (i.e. the middle yellow color is longer and the reds and blues get shorter as you approach the end). – Massagran Oct 27 '12 at 21:35
  • @Massagran - I noticed that too. Wasn't able to decide whether I thought it likely to be an artefact of scaling, or if it was a matter of a non linear gradient. Think I'll examine a png of it with some code to get the colours of each row. I can see a nice excel graph coming of this. :wink: .the question remains interesting. – enhzflep Oct 27 '12 at 21:41
  • @Massagran - not sure if you get notified when I edited my post. Sorry for the double-up if you do.. See updated answer for graphs of the changing h,s,v & r,g,b values. :) – enhzflep Oct 27 '12 at 23:40
  • 2
    The rgb graph looks like a smoothed version of [matlabs jet colormap](http://4.bp.blogspot.com/-OTAL6CoX4_U/T1cHIWRHpVI/AAAAAAAAAT8/SEl9fJESXR0/s1600/jetchannels.png) – Junuxx Oct 28 '12 at 00:16
  • the jet colormap however doesn't show this weird non-linearity (thicker bands in the center). I'm almost tempted to see 3 cosine functions gone a little awry :) I'll try to code that see if I can reproduce it. Thank you. – Massagran Oct 28 '12 at 00:20
  • 1
    @Massagran, enhzflep: This "weird non-linearity" might have something to do with the [**spectral sensitivity**](http://en.wikipedia.org/wiki/Spectral_sensitivity) of the human eye? – Junuxx Oct 30 '12 at 21:43
  • @Junuxx - Perhaps. Nice thinking! – enhzflep Oct 30 '12 at 22:21
2

I would recomend to define an area where you want to compare the colour. Take an FFT of the regions. Each colour is defined by a frequency. You do the same on the countour scale. then compare and narrow on a value.

I have found some like to understand it better.

http://www.imagemagick.org/Usage/fourier/

Sri
  • 21
  • 1
1

You can get something like that by varying the hue with a fixed saturation and luminance.

http://en.wikipedia.org/wiki/HSL_and_HSV

FogleBird
  • 74,300
  • 25
  • 125
  • 131