37

I've poked around, but been unable to find an answer. I want to do a weighted geom_bar plot overlaid with a vertical line that shows the overall weighted average per facet. I'm unable to make this happen. The vertical line seems to a single value applied to all facets.

require('ggplot2')
require('plyr')

# data vectors
panel <- c("A","A","A","A","A","A","B","B","B","B","B","B","B","B","B","B")
instrument <-c("V1","V2","V1","V1","V1","V2","V1","V1","V2","V1","V1","V2","V1","V1","V2","V1")
cost <- c(1,4,1.5,1,4,4,1,2,1.5,1,2,1.5,2,1.5,1,2)
sensitivity <- c(3,5,2,5,5,1,1,2,3,4,3,2,1,3,1,2)

# put an initial data frame together
mydata <- data.frame(panel, instrument, cost, sensitivity)

# add a "contribution to" vector to the data frame: contribution of each instrument
# to the panel's weighted average sensitivity.
myfunc <- function(cost, sensitivity) {
  return(cost*sensitivity/sum(cost))
}
mydata <- ddply(mydata, .(panel), transform, contrib=myfunc(cost, sensitivity))

# two views of each panels weighted average; should be the same numbers either way
ddply(mydata, c("panel"), summarize, wavg=weighted.mean(sensitivity, cost))
ddply(mydata, c("panel"), summarize, wavg2=sum(contrib))

# plot where each panel is getting its overall cost-weighted sensitivity from. Also
# put each panel's weighted average on the plot as a simple vertical line.
#
# PROBLEM! I don't know how to get geom_vline to honor the facet breakdown. It
#          seems to be computing it overall the data and showing the resulting
#          value identically in each facet plot.
ggplot(mydata, aes(x=sensitivity, weight=contrib)) +
  geom_bar(binwidth=1) +
  geom_vline(xintercept=sum(contrib)) +
  facet_wrap(~ panel) +
  ylab("contrib")

Gavin Simpson
  • 170,508
  • 25
  • 396
  • 453
user1443547
  • 373
  • 1
  • 3
  • 4
  • 1
    I had this thing not working b/c my x-axis was a factor. Took a while to understand why it does not appear. – Ufos Jun 11 '19 at 17:11

3 Answers3

37

If you pass in the presumarized data, it seems to work:

ggplot(mydata, aes(x=sensitivity, weight=contrib)) +
  geom_bar(binwidth=1) +
  geom_vline(data = ddply(mydata, "panel", summarize, wavg = sum(contrib)), aes(xintercept=wavg)) +
  facet_wrap(~ panel) +
  ylab("contrib") +
  theme_bw()

enter image description here

Chase
  • 67,710
  • 18
  • 144
  • 161
  • Fine solution, but incorrect assessment of the problem. The problem is two-fold: (1) data is not summarised by panel, but rather a constant; (2) `sum(contrib)` is not passed to the `mapping`-function (`aes`). – o_v Apr 01 '22 at 14:21
32

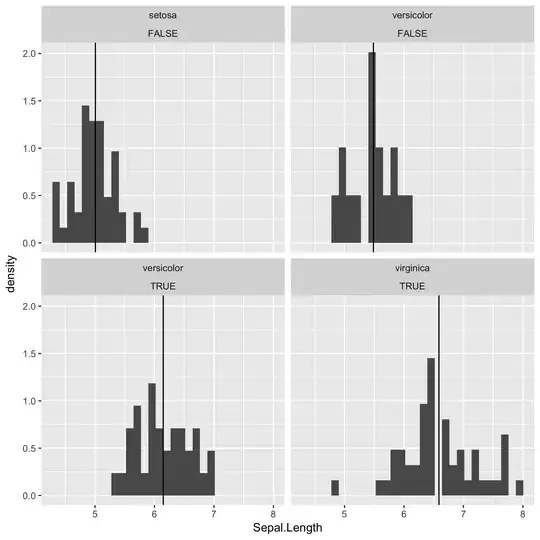
Example using dplyr and facet_wrap incase anyone wants it.

library(dplyr)
library(ggplot2)

df1 <- mutate(iris, Big.Petal = Petal.Length > 4)
df2 <- df1 %>%
  group_by(Species, Big.Petal) %>%
  summarise(Mean.SL = mean(Sepal.Length))

ggplot() +
  geom_histogram(data = df1, aes(x = Sepal.Length, y = ..density..)) +
  geom_vline(data = df2, mapping = aes(xintercept = Mean.SL)) +
  facet_wrap(Species ~ Big.Petal) 

enter image description here

R.Sanchez
  • 3,366
  • 1
  • 13
  • 6
  • 4
    Great answer. What about making >1 line within each plot? So xintercept will consists of multiple collumns – JdP Aug 13 '18 at 12:50
4
 vlines <- ddply(mydata, .(panel), summarize, sumc = sum(contrib))
 ggplot(merge(mydata, vlines), aes(sensitivity, weight = contrib)) + 
 geom_bar(binwidth = 1) + geom_vline(aes(xintercept = sumc)) + 
 facet_wrap(~panel) + ylab("contrib")
Maiasaura
  • 32,226
  • 27
  • 104
  • 108