So I have a set of data (df) where there are some values a1, a2, and a3 generated by date and by group (b1, b2, b3). I want to stack these scatterplots on each other and facet wrap by group (seems to work). a1, a2 and a3 should be 3 different colors.
Then I have a second set of data (shuffled_dates) that I want to graph on the SAME plot as vertical x intercepts at certain dates. These I want to be dashed red lines and separated out also by group.
The problem Im having is that all the shuffled_dates are going on all the df values instead of by group (by b1, b2, b3 etc).
I've spent some time on this and am stumped, can someone explain why this is happening and suggest a way to fix it? Thank you
library(dplyr)
library(ggplot2)
set.seed(12)

dates <-seq(as.Date("2022-01-01"), as.Date("2022-04-15"), by="days") %>% data.frame(Date = .)
dates2 <- dates[1:50,] %>% data.frame(Date = .)

name <- c("b1","b2","b3") %>% rep(20) %>% data.frame()
Names <- name[sample(1:50),] #for df
Names2 <- name[sample(1:15),] #for shuffled data

df <- data.frame(dates2, a1 = sample(50, 50, TRUE), a2= sample(50, 50, TRUE), a3= sample(50, 50, TRUE))
df <- cbind(df,Names)
df<-df %>% group_by(Names) #not sure if this matters for the graph

shuffled_dates= dates[sample(1:105), ] %>% data.frame(Date = .) %>% slice(1:15)
shuffled_dates <- cbind(shuffled_dates,Names2)
shuffled_dates <- shuffled_dates %>% group_by(Names2) #not sure if this matters for the graph

head(df)
# A tibble: 6 x 5
# Groups:   Names [3]
  Date          a1    a2    a3 Names
  <date>     <int> <int> <int> <chr>
1 2022-01-01     8    49    30 b2
2 2022-01-02    30     2    29 b2
3 2022-01-03    42    20    48 b3
4 2022-01-04    37    15    27 b3
5 2022-01-05    43    39    14 b3
6 2022-01-06    27    31    31 b1

head(shuffled_dates)
# A tibble: 6 x 2
# Groups:   Names2 [3]
  Date       Names2
  <date>     <chr>
1 2022-04-13 b2
2 2022-01-23 b1
3 2022-02-23 b3
4 2022-03-26 b2
5 2022-04-08 b3
6 2022-03-05 b3

plot1 <- ggplot(
  data=df, aes(x=Date, y=a1))+
  geom_point(color = "red") +
  ylim(0, 50)+
  facet_wrap(~Names, ncol = 2)+
  geom_point(aes(y=a2), color = "orange") +
  geom_point(aes(y=a3), color = "purple")
plot1

plot1 + geom_vline(xintercept=as.numeric(shuffled_dates$Date),color="red",inherit.aes = TRUE)

# A couple other things I tried that didn't work
# plot1 + geom_vline(xintercept=as.numeric(shuffled_dates$Date), color="red")
# plot1 + geom_vline(aes(group=Names2),xintercept=as.numeric(shuffled_dates$Date), color="red")
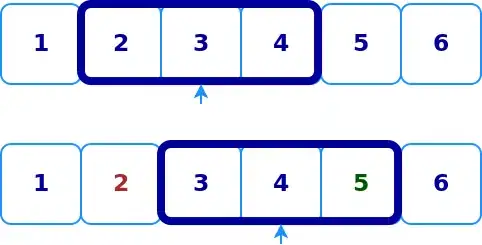
Example of what I'd like to get (with fake date lines):

Related questions: How to get geom_vline to honor facet_wrap?
How to produce different geom_vline in different facets in R?
edit, requested dput(df):
structure(list(Date = structure(c(18993, 18994, 18995, 18996,
18997, 18998, 18999, 19000, 19001, 19002, 19003, 19004, 19005,
19006, 19007, 19008, 19009, 19010, 19011, 19012, 19013, 19014,
19015, 19016, 19017, 19018, 19019, 19020, 19021, 19022, 19023,
19024, 19025, 19026, 19027, 19028, 19029, 19030, 19031, 19032,
19033, 19034, 19035, 19036, 19037, 19038, 19039, 19040, 19041,
19042), class = "Date"), a1 = c(8L, 8L, 38L, 18L, 39L, 16L, 36L,
31L, 20L, 16L, 48L, 40L, 36L, 8L, 41L, 28L, 44L, 7L, 13L, 36L,
14L, 3L, 44L, 19L, 6L, 34L, 8L, 9L, 19L, 29L, 25L, 39L, 19L,
16L, 18L, 25L, 43L, 23L, 44L, 34L, 37L, 49L, 10L, 8L, 25L, 39L,
15L, 36L, 5L, 5L), a2 = c(30L, 21L, 33L, 32L, 47L, 33L, 45L,
42L, 48L, 41L, 33L, 29L, 33L, 40L, 29L, 41L, 11L, 49L, 9L, 1L,
45L, 42L, 33L, 44L, 30L, 15L, 43L, 30L, 36L, 17L, 30L, 22L, 44L,
23L, 22L, 14L, 40L, 6L, 5L, 18L, 35L, 35L, 4L, 22L, 13L, 26L,
27L, 6L, 19L, 21L), a3 = c(26L, 44L, 48L, 25L, 33L, 41L, 13L,
22L, 38L, 44L, 7L, 15L, 21L, 9L, 36L, 33L, 15L, 9L, 15L, 41L,
26L, 28L, 13L, 43L, 19L, 19L, 41L, 34L, 3L, 13L, 11L, 21L, 50L,
8L, 13L, 49L, 11L, 27L, 42L, 49L, 32L, 15L, 3L, 28L, 14L, 40L,
1L, 21L, 34L, 33L), Names = c("b1", "b2", "b1", "b1", "b2", "b2",
"b3", "b1", "b1", "b3", "b1", "b2", "b3", "b2", "b1", "b1", "b2",
"b3", "b1", "b2", "b1", "b2", "b3", "b2", "b3", "b3", "b2", "b2",
"b3", "b1", "b2", "b2", "b1", "b2", "b2", "b3", "b3", "b3", "b3",
"b3", "b2", "b3", "b2", "b3", "b1", "b1", "b1", "b3", "b1", "b1"
)), class = c("grouped_df", "tbl_df", "tbl", "data.frame"), row.names = c(NA,
-50L), groups = structure(list(Names = c("b1", "b2", "b3"), .rows = structure(list(
    c(1L, 3L, 4L, 8L, 9L, 11L, 15L, 16L, 19L, 21L, 30L, 33L,
    45L, 46L, 47L, 49L, 50L), c(2L, 5L, 6L, 12L, 14L, 17L, 20L,
    22L, 24L, 27L, 28L, 31L, 32L, 34L, 35L, 41L, 43L), c(7L,
    10L, 13L, 18L, 23L, 25L, 26L, 29L, 36L, 37L, 38L, 39L, 40L,
    42L, 44L, 48L)), ptype = integer(0), class = c("vctrs_list_of",
"vctrs_vctr", "list"))), class = c("tbl_df", "tbl", "data.frame"
), row.names = c(NA, -3L), .drop = TRUE))

