78

I am trying to teach myself the Google Closure javascript library. I am examining the TreeControl UI widget.

How can I use Chrome Console to analyze what functions are run when I click on the "Cut" button in the demo below? For instance, can I somehow set a break point for that? I've tried viewing the source and looking around, but I feel that Chrome Console may offer a more systematic method.

https://github.com/google/closure-library/blob/master/closure/goog/demos/tree/demo.html

Kai
  • 9,038
  • 5
  • 28
  • 28
dangerChihuahua007
  • 20,299
  • 35
  • 117
  • 206

4 Answers4

127

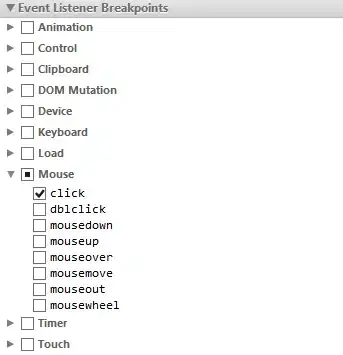
You may be looking for the "Event Listener Breakpoints" section on the right side of the Debugger area. Open that up and select the click event under "mouse". See the screen image. Then click on the button in the app and you will immediately be taken to the code being executed.

enter image description here

  • 9
    This is cool, but it would be nice to be able to skip the jQuery and get taken to your function, I think IE11 has this, hard to believe that IE has a feature that I want, that Chrome doesn't – Serj Sagan May 02 '14 at 00:20
  • 19
    Serj Sagan - you can skip any js file from being traced by opening developer tools (f12), hitting f1 (settings), clicking the Blackboxing menu item from left side, and entering the name of the file you want to skip (such as jquery.js). Then you won't be interrupted with impossible to trace javascript library code you don't care about, and can focus on the stuff YOU (or another developer) wrote and want to diagnose. – Don Kelley Feb 02 '16 at 23:41
  • 1
    @SerjSagan this is so relevant to the answer. I suggest editing the answer and adding this information to it. – Dandelion Nov 11 '19 at 14:27
  • "Blackboxing" is now "Ignore List" in the settings, by the way – shannon Oct 05 '21 at 12:03
38

With the Chrome Developer Tools window open, click on the "Sources" tab. If you don't see anything you may need to click on the "Show Navigator" button in the upper-left corner of that tab. With the navigator open, navigate to the file where the cut() function is defined (in your case it's demo.html). When you bring the file into view, find the line where the cut() function is defined and then set a breakpoint on the first line within that function. You can set a breakpoint by clicking the line number on the left side.

Once you've set your breakpoint(s), do something on the page that would trigger the cut() function and the browser should break script execution as soon as it enters the cut() function (assuming your breakpoint is on the first line within the cut() function). From this point you can use the controls on the top right of the tab to step in/out/around code and see what's going on.

Here's a screenshot of me doing it: http://d.pr/i/f6BO

Also, here's a great video that talks about using the Chrome Dev tools, including setting breakpoints: http://www.youtube.com/watch?v=nOEw9iiopwI
Kai
  • 9,038
  • 5
  • 28
  • 28
18

The thing that you are looking for is called 'Profiling'.

It can be achieved by:

  1. Go to Profiles
  2. Choose first option ('Collect JavaScript CPU Profile')
  3. Start it before pressing button 'Cut'
Jackie Chan
  • 2,654
  • 6
  • 35
  • 70
5

This may be helpful for some people:

You can right click an element on the elements tab and use 'break on' to break on e.g. sub element modification. https://developer.chrome.com/devtools/docs/javascript-debugging

timhc22
  • 7,213
  • 8
  • 48
  • 66