2

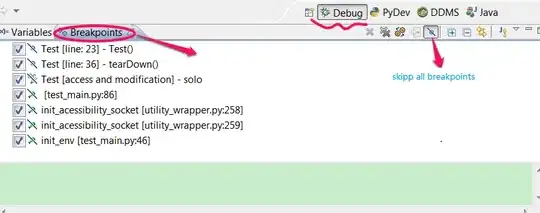
Breakpoints have been working for me for many weeks, but yesterday they stopped working. When I create a breakpoint icon shown is not the usual magnifying glass, but instead is the magnifying glass with a line through it.

I tried the suggestions in pydev breakpoints not working

E.g.

import sys
print 'current trace function', sys.gettrace()

which reports "current trace function main.PyDB object at 0x101416090>> "

I tried accessing breakpoints in another Python project and the breakpoints there have the same problem. Restarting Eclipse, the Mac and reinstalling PyDev had no effect.

I tried installing PyDev in another Eclipse installation on my Mac and breakpoints in Python work find there.

Any ideas, anyone?

Community
  • 1
  • 1

2 Answers2

10

screenshot should be like this:

enter image description here

That is because you have enable "skip all breakpoints" in Eclipse, show it here: enter image description here

Also useful info:

skip all breakpoints in eclipse

different breakpoints annotations meanings in eclipse

another alias question:eclipse-pydev-breakpoint-does-not-stop-and-show-a-different-icon

Community
  • 1
  • 1
Steve Wang
  • 335
  • 1
  • 3
  • 11
3

If it shows a line through it, you probably clicked the 'skip all breakpoints' in the breakpoints view... in which case it'd be a matter of clicking that option again?

If that's not it, please post a screenshot and take a look at your error log for something related...

Fabio Zadrozny
  • 24,814
  • 4
  • 66
  • 78