I use the following code to visualize some SpatialPolygonsDataFrame with ggplot2:
require(shapefiles)
require(sp)

xx <- readShapeSpatial(system.file("shapes/sids.shp", package="maptools")[1],
                   IDvar="FIPSNO", proj4string=CRS("+proj=longlat +ellps=clrk66"))


xx.ff <- fortify(xx,region="NAME")

x <- ggplot(xx.ff) +
aes(long,lat, fill = id) +
geom_polygon()
to end up with:
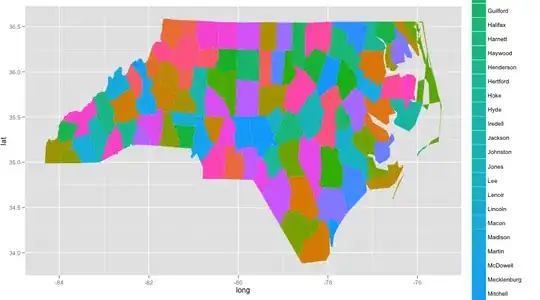
Assume that I am using fill to represent something else, like regional theft rate. Thus I want to label those regions with their names. is there a way to write the regions name right onto the map into the corresponding region, e.g. I want to write Halifax right onto the region.