This is not so much an answer to your original question as to one of the queries you had in the body of your question.
A little preamble, so that my naming doesn't seem strange:
import matplotlib
from matplotlib import rc
from matplotlib.figure import Figure
ax = self.figure.add_subplot( 111 )
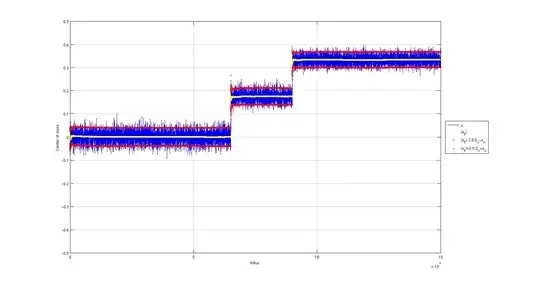
As has been mentioned you can use ticklabel_format to specify that matplotlib should use scientific notation for large or small values:
ax.ticklabel_format(style='sci',scilimits=(-3,4),axis='both')
You can affect the way that this is displayed using the flags in rcParams (from matplotlib import rcParams) or by setting them directly. I haven't found a more elegant way of changing between '1e' and 'x10^' scientific notation than:
ax.xaxis.major.formatter._useMathText = True
This should give you the more Matlab-esc, and indeed arguably better appearance. I think the following should do the same:
rc('text', usetex=True)