61

I have a very simple question causing me to bang my head on the wall.

I would like to scale the y-axis of my histogram to reflect the proportion (0 to 1) that each bin makes up, instead of having the area of the bars sum to 1, as using y=..density.. does, or having the highest bar be 1, as y=..ncount.. does.

My input is a list of names and values, formatted like so:

name    value
A   0.0000354
B   0.00768
C   0.00309
D   0.000123

One of my failed attempts:

library(ggplot2)
mydataframe < read.delim(mydata)
ggplot(mydataframe, aes(x = value)) +
geom_histogram(aes(x=value,y=..density..))

This gives me a histogram with area 1, but heights of 2000 and 1000:

try

and y=..ncount.. gives me a histogram with highest bar 1.0, and rest scaled to it:

try

but I would like to have the first bar have a height of 0.5, and the other two 0.25.

R does not recognize these uses of scale_y_continuous either.

scale_y_continuous(formatter="percent")
scale_y_continuous(labels = percent)
scale_y_continuous(expand=c(1/(nrow(mydataframe)-1),0)

Thank you for any help.
gkcn
  • 1,360
  • 1
  • 12
  • 23
First Last
  • 629
  • 1
  • 6
  • 7

5 Answers5

86

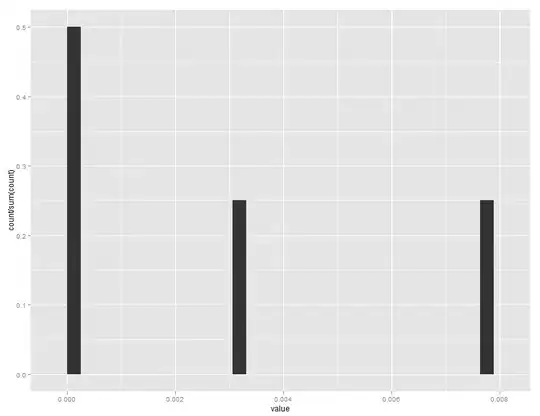
Note that ..ncount.. rescales to a maximum of 1.0, while ..count.. is the non scaled bin count.

ggplot(mydataframe, aes(x=value)) +
  geom_histogram(aes(y=..count../sum(..count..)))

Which gives:

enter image description here

Andy
  • 4,549
  • 31
  • 26
  • 1
    This is exactly what I was looking for. You make feel feel like a idiot, and I am truly thankful for you! – First Last Aug 01 '12 at 20:37
  • 11
    I had no idea it was possible to do something like this. Thanks to this tip I'm able to produce a survival/reliability (i.e. 1-CDF) histogram by using `aes(y=1-cumsum(..count..)/sum(..count..))`. – dnlbrky Jun 25 '13 at 20:40
42

As of the latest and greatest ggplot2 version 3.0.0, the format has changed. Now you can wrap the y value in stat() rather than messing with .. stuff.

ggplot(mydataframe, aes(x = value)) +
  geom_histogram(aes(y = stat(count / sum(count))))
CephBirk
  • 6,422
  • 5
  • 56
  • 74
  • 2
    @CephBirkSuppose I also specify a `fill=column` to the aesthetic. Does `count/sum(count)` normalize by the total number, or the number in each fill group? – saintsfan342000 Nov 20 '20 at 03:27
  • This answer addresses that issue: https://stackoverflow.com/a/22181949/188963. – abalter Feb 10 '21 at 21:54
24

As of ggplot2 0.9, many of the formatter functions have been moved to the scales package, including percent_format().

library(ggplot2)
library(scales)

mydataframe <- data.frame(name = c("A", "B", "C", "D"),
                          value = c(0.0000354, 0.00768, 0.00309, 0.000123))

ggplot(mydataframe) + 
  geom_histogram(aes(x = value, y = ..ncount..)) +
  scale_y_continuous(labels = percent_format())
aaronwolen
  • 3,723
  • 1
  • 20
  • 21
1

Summarizing the above answers:

library(tidyverse)

mydataframe <- data.frame(name = c("A", "B", "C", "D"),
                          value = c(0.0000354, 0.00768, 0.00309, 0.000123))

ggplot(mydataframe, aes(x = value)) +
  geom_histogram(aes(y = stat(count / sum(count)))) +
  scale_y_continuous(labels = scales::percent_format()) +
  labs(x="", y="")

enter image description here

Nick Vence
  • 754
  • 1
  • 9
  • 19
0

I just wanted to scale the axis, to divide the y-axis by 1000, so I did:

ggplot(mydataframe, aes(x=value)) +
  geom_histogram(aes(y=..count../1000))
Willian Adamczyk
  • 1,691
  • 1
  • 9
  • 7