15

I want to visualize a graph that represents some geographical map. As such, the edges of my graph are associated with the compass rose (north, south, east, west). The graph itself is directed and can be made acyclic.

For example I have nodes: House-1, House-2, House-3 with edges [House-1, north-of, House-2], [House-2, east-of, House-3].

I'm looking for a layout algorithm that can be made to understand the compass rose (perhaps as hints?)

I've gone through JUNG, JGraph, GraphViz and none seem to do what I want but I may have missed something.

Any suggestions?
DaoWen
  • 32,589
  • 6
  • 74
  • 101
  • See also [`CompassButtons`](http://stackoverflow.com/a/10862262/230513). – trashgod Aug 12 '12 at 17:19
  • Possible duplicate of [Add a complex image in the panel, with buttons around it in one customized user interface](http://stackoverflow.com/questions/10861852/add-a-complex-image-in-the-panel-with-buttons-around-it-in-one-customized-user) – trashgod Aug 12 '12 at 17:19
  • 10
    The poster is looking for a *graph layout algorithm* for a tool like GraphViz, but needs it to take relative positioning hints. He doesn't need a GUI layout manager, but rather he needs a layout engine that can work with something like a [dot file](http://www.graphviz.org/doc/info/lang.html) and produce an image. In that light, I don't think either of the above comments are relavent (i.e. *this is not a duplicate post*). – DaoWen Aug 13 '12 at 05:13
  • Did you have a look at Gephi? – Thomas Jungblut Aug 17 '12 at 08:00
  • Can the problem be simplified such that a given node can only have one connection to another node via a given directional edge - e.g. only one house can be east of another? – orangepips Aug 20 '12 at 19:43

2 Answers2

3

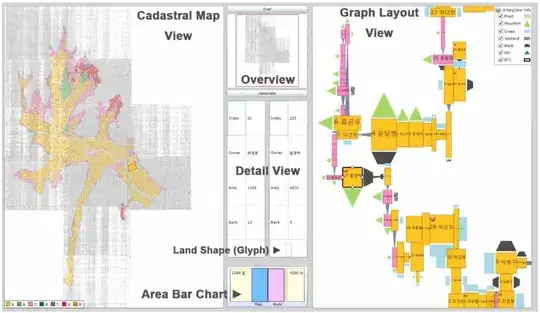
There was a recent paper that dealt with this problem, in which they were trying to reconstruct old Korean land records (cadasters). There is a layout algorithm in the paper that should do what you want. It doesn't provide all the details, but it does give the outline and citations to specifics.

Hyungmin Lee, Sooyun Lee, Namwook Kim, and Jinwook Seo. 2012. JigsawMap: connecting the past to the future by mapping historical textual cadasters. In Proceedings of the 2012 ACM annual conference on Human Factors in Computing Systems (CHI '12). ACM, New York, NY, USA, 463-472. DOI=10.1145/2207676.2207740.

JigsawMap Example

edallme
  • 949
  • 5
  • 8
  • You're violating the copyright terms by posting the PDF: _To copy otherwise, or republish, **to post on servers** or to redistribute to lists, requires prior specific permission and/or a fee._ – DaoWen Aug 24 '12 at 02:24
  • The paper you referenced also has a couple of citations in the Related Work section. It looks like this is the best answer-attempt we'll be getting, so I'll award you the bounty. – DaoWen Aug 24 '12 at 02:47
0

@edallme : Nice document, interesting !

@DaoWen :

What I understand in your post is that you are searching for an algorithm to place all the blocks on the map rather than a "widget" to do it (so maybe am I wrong ?).

If you are asking about ideas to calculate how to place the blocks (knowing that "The graph itself is directed and can be made acyclic"), the following method should work, independently of what graph lib you are using.:

You can try out to -first- generate a dependance map such as each node is constrained by the others (relative position and offset, eg SOUTH/30units). This bunch of code should check for incoherences as well.

Second, calculate the relative position of each block, storing the min and max somewhere (cf part 3), and the reference to the objects having the min/max positions.

Third, you should be able to virtually generate the full-size diagram dimensions with the min/max relative positions.

Then, you "just" have to draw it from a corner.

Benj
  • 1,184
  • 7
  • 26
  • 57