9

I have the following code to create a plot. On the x- and y-axes there are symbols that appear on the screen, in a JPEG when I save my plot in that format, but not when I save the plot as a PDF.

Is there alternative symbol to my \u2030 that will print in my PDF or another solution to my problem? See examples below of the correct (JPEG format) and the incorrect (PDF) plots .

plot(c(-1,1), c(-1,1), bty = "n", type= "n", las = 1, cex.lab = 1.5, cex.axis = 1.25, main = NULL, 
ylab=expression(paste("Correlation Coefficient (r) for ", delta ^{15},"N"," \u0028","\u2030","\u0029")), 
xlab=expression(paste("Correlation Coefficient (r) for ", delta ^{13},"C"," \u0028","\u2030","\u0029")))
axis(1, at = seq(-1.0, 1.0, by = 0.1), labels = F, pos = 0, cex.axis = 0.05, tcl = 0.25)
axis(2, at = seq(-1.0, 1.0, by = 0.1), labels = F, pos = 0, cex.axis = 0.05, tcl = 0.25)

enter image description here enter image description here

user213544
  • 2,046
  • 3
  • 22
  • 52
Keith W. Larson
  • 1,543
  • 2
  • 19
  • 34
  • 3
    Have you tried another pdf device, like `cairo_pdf`? – Roman Luštrik Aug 23 '12 at 16:28
  • I can't spot anything that seems "incorrect" to me? – Marcus Riemer Aug 23 '12 at 16:28
  • I tried cairo_pdf but get an error when I run the `plot` command as above. – Keith W. Larson Aug 23 '12 at 16:32
  • one workaround (if your end goal is a plot for inclusion in a LaTeX document ...) is the `tikzDevice` package (currently exiled from CRAN). Have you tried using `symbol()` as in `?plotmath`? see also http://stackoverflow.com/questions/5886018/using-unicode-dingbat-like-glyphs-in-r-graphics-across-devices-platforms-e [what error do you get with cairo_pdf ? it worked for me in a similar situation] – Ben Bolker Aug 23 '12 at 16:41
  • works for me with `cairo_pdf` on Ubuntu 10.04, R-devel. (What error message are you getting?) – Ben Bolker Aug 23 '12 at 16:47
  • when I run `cairo_pdf` I get the following error: `Error in title(...) : Metric information not available for this device` – Keith W. Larson Aug 23 '12 at 16:49
  • What's your R version/sessionInfo()? http://r.789695.n4.nabble.com/Problem-using-mtext-to-write-onto-a-jpeg-td4635258.html – Ben Bolker Aug 23 '12 at 17:12
  • R version 2.14.0 (2011-10-31) Platform: i386-pc-mingw32/i386 (32-bit) – Keith W. Larson Aug 23 '12 at 17:22
  • 1
    If someone with Mac is struggling with this problem, switching the device to `cairo_pdf` solves the issue as many have pointed out here. `cairo_pdf` with `ggplot2` also seems to reproduce the OS specific permil sign correctly. i.e. if you just type "`‰`" instead of `\u2030`. – Mikko Mar 27 '14 at 10:54

4 Answers4

4

The problem is that your default font does not have "‰" (which I would speak as "per mil") as the glyph that is produced with \u0028. You need to change to a font that does have that glyph:

?pdfFonts

This is what I get with my setup where there is no problem (at least as I understand ti.)

> str(pdfFonts("sans"))
List of 1
 $ sans:List of 3
  ..$ family  : chr "Helvetica"
  ..$ metrics : chr [1:5] "Helvetica.afm" "Helvetica-Bold.afm" "Helvetica-Oblique.afm" "Helvetica-BoldOblique.afm" ...
  ..$ encoding: chr "default"
  ..- attr(*, "class")= chr "Type1Font"
IRTFM
  • 258,963
  • 21
  • 364
  • 487
  • 1
    I get the same output, but can replicate the problem with the default encoding. – Roland Aug 23 '12 at 17:46
  • I had no difficulty with the default encoding on my Mac. (Which may not be helpful to the OP who has not disclosed his OS.) – IRTFM Aug 23 '12 at 17:47
  • His comment above says: `R version 2.14.0 (2011-10-31) Platform: i386-pc-mingw32/i386 (32-bit)` – Ben Bolker Aug 23 '12 at 17:51
  • Might be the locale. `sessionInfo()$locale` tells me I am using "C/en_US.UTF-8/C/C/C/C". – Roland Aug 23 '12 at 17:51
  • Ok, I missed that he was on a Windows machine. He's not likely to have Helvetica. My locales are [1] en_US.UTF-8/en_US.UTF-8/en_US.UTF-8/C/en_US.UTF-8/en_US.UTF-8 which I think are default, so @Roland, I think you did something non-standard for your install. – IRTFM Aug 23 '12 at 17:55
  • If I understand `?locales` right "C", "which is the default for the C language and reflects North-American usage" is standard. – Roland Aug 23 '12 at 18:07
  • Our understandings differ (but I do see what you are reading in that help page.) We should probably move this to R-SIG-Mac. – IRTFM Aug 23 '12 at 18:11
3

You probably have to change the encoding. On my mac this gets me the ‰ sign:

pdf('test.pdf',encoding="MacRoman")
plot.new()
text(0,labels="\u2030")
dev.off()

Look in the ‘enc’ directory of package grDevices for available encodings and try them out.

Roland
  • 127,288
  • 10
  • 191
  • 288
  • When I try your code I get `Error in text.default(0, labels = "‰") : unknown encoding 'MacRoman' in 'mbcsToSbcs`. Any suggestions on what this means and how to solve it? – Keith W. Larson Aug 23 '12 at 20:31
  • Yes. You need to try a different encoding since you are not on a mac, but using windows. – Roland Aug 24 '12 at 06:48
  • 1
    After testing on my windows machine at work: I cannot replicate your problem and the code runs fine also with encoding `MacRoman`, which should be available on windows, too. I suggest to install the newest R version (2.15.1) and if the problem persists give us the whole output of `sessionInfo()`. – Roland Aug 24 '12 at 06:56
  • I will update to the news version of R and let you all know. Thanks! – Keith W. Larson Aug 30 '12 at 07:40
1

I had the same problem to save in PDF form with MAC. I am saving with ggsave and MacRoman.

ggsave("Name_of_your_file.pdf", #choose your own name
   encoding="MacRoman",
   width = 20, #size that you want
   height = 20, #size that you want
   units = "cm")

It will save your file where you saved your R file.

Delphine
  • 11
  • 1
-1

Depending on whether or not your system has the needed true font files [hint: install the showtext package and use View(font_files()] you should be able to get available unicode characters into pdf files by

  1. Exporting first to a temporary file, say "temp.png"
  2. Exporting to the pdf file using pdf() or cairo_pdf(), say "UnicodeToPDF.pdf"
  3. Combine the use of grid.arrange (from gridExtra), rasterGrob (from grid), and readPNG (from png) to insert the temp.png file into the UnicodeToPDF.pdf file
  4. Removing the "temp.png" file
#--- A function to install missing packages and load them all
myfxLoadPackages = function (PACKAGES) {
  lapply(PACKAGES, FUN = function(x) {
    if (suppressWarnings(!require(x, character.only = TRUE))) {
      install.packages(x, dependencies = TRUE, repos = "https://cran.rstudio.com/")
    }
  })
  lapply(PACKAGES, FUN = function(x) library(x, character.only = TRUE))
}

packages = c("gridExtra","grid","png")
myfxLoadPackages(packages)

#--- The trick to get unicode characters being printed on pdf files:
#--- 1. Create a temporary file, say "temp.png"
#--- 2. Create the pdf file using pdf() or cairo_pdf(), say "UnicodeToPDF.pdf"
#--- 3. Combine the use of grid.arrange (from gridExtra), rasterGrob (from grid), and readPNG (from png) to insert the
#       temp.png file into the UnicodeToPDF.pdf file
Corrvalues = data.frame(X=seq(-0.8,0.8,0.2),
                        Y=seq(-0.8,0.8,0.2),
                        PCH=-c(10122:10130)) #--- This is equivalent to using unicode characters 10122-10130 (note the use of -)
#--- Refer to http://xahlee.info/comp/unicode_index.html to see more unicode character integers

png("temp.png", width=11, height=11, units="in", res=300)
par(mar=c(4,5,3,1) + 0.1)
plot(c(-1,1), c(-1,1), bty = "n", type= "n", las = 1, cex.lab = 1.5, cex.axis = 1.25, main = NULL, 
     ylab=expression(paste("Correlation Coefficient (r) for ", delta ^{15},"N"," \u0028","\u2030","\u0029")), 
     xlab=expression(paste("Correlation Coefficient (r) for ", delta ^{13},"C"," \u0028","\u2030","\u0029")))
axis(1, at = seq(-1.0, 1.0, by = 0.1), labels = F, pos = 0, cex.axis = 0.05, tcl = 0.25)
axis(2, at = seq(-1.0, 1.0, by = 0.1), labels = F, pos = 0, cex.axis = 0.05, tcl = 0.25)
points(Corrvalues$X,Corrvalues$X,pch=Corrvalues$PCH,cex=2.75,col="#FF7F00")
dev.off()

pdf("UnicodeToPDF.pdf", width=11, height=11)
grid.arrange(
  rasterGrob(
    readPNG(
      "temp.png",
      native=F
    )
  )
)
dev.off()

file.remove("temp.png")

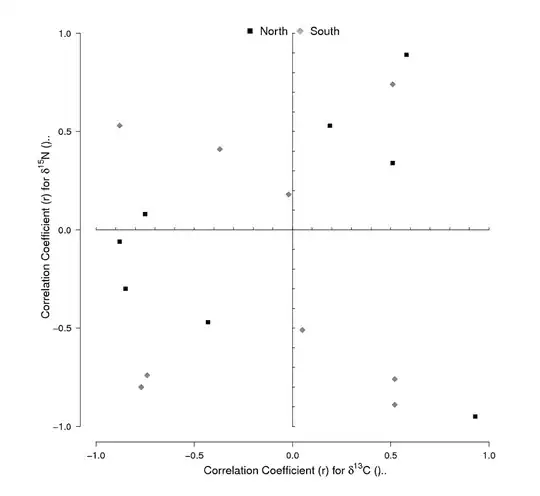
The following image has been added to follow up on Konrad Rudolph's comments. enter image description here

  • This is fundamentally not equivalent to, and not a substitute for, saving to PDF. You are rasterising the image to PNG and put that into a PDF. That isn’t the same at all (zoom in!), and in most cases you don’t need to bother about the PDF at all then — just stick with the PNG. – Konrad Rudolph Sep 17 '20 at 07:30
  • Here is the zoom in on the original question: "Is there alternative symbol to my \u2030 that will print in my PDF or another solution to my problem?" As you can see alternative solutions to the problem are welcome. At least in my Windows system, when I run the code I proposed I cannot see any difference between the image saved in the temp.png and the image inserted inside the pdf. Unicode characters get printed to a pdf and that is the alternative solution I provided. May you please elaborate in what could go so wrong with my solution to cause a noticeable difference between the two images? – James Silva Sep 17 '20 at 22:09
  • “May you please elaborate in what could go so wrong with my solution to cause a noticeable difference between the two images?” — I mean you should *literally* zoom in on the picture. You’ll see that it’s rasterised instead of being a vector graphic that scales losslessly. – Konrad Rudolph Sep 17 '20 at 22:30
  • Well, I spent a few minutes putting the two images side-by-side, zooming in as much as I could, and I could not spot any difference. From a practical perspective, it will be extremely difficult that a human eye can look at the two images and be able grasp any difference and end up detecting lack of vector graphics; therefore, the decision whether or not the provided solution is as bad as you think for a very specific visualization should be left to the user. It is good that you have encouraged the community to do the zoom-in first, before making a final call. Thanks. – James Silva Sep 18 '20 at 12:25
  • I don’t believe you actually did that, because [the difference is blindingly, strikingly obvious](https://i.imgur.com/tLX7VAv.png). Of course this is zoomed but you even see the difference when it’s *not* zoomed. And it looks even worse when printing. And the PNG version is also about 10-fold larger than the PDF. Increasing the DPI would increase the file size even more. — Anyway, maybe this isn’t an issue for your use-case, and that’s totally legitimate. But then you don’t use PDF, *you use PNG*. But OP wants a PDF, and your solution is therefore generally not helpful. – Konrad Rudolph Sep 18 '20 at 12:54
  • You are right, I did not make the zoom in using your machine, I did it using my R-4.01 Windows 10 machine. I updated my post with what I see after zooming in on one of the unicode characters using Acrobat Reader. Regarding file size, I got a PNG of 64KB vs a PDF of 83KB, definitely not a 10-fold increase. It has been a good learning for me though. Thanks. – James Silva Sep 18 '20 at 13:48