Is there a way to create a heat map in google earth, so areas with higher values (of some specified parameter, such as population) appear as hotspots?
Asked
Active
Viewed 3.2k times
11
-
1have you have any luck so far? – dassouki Jul 21 '10 at 12:54
-
1I ended up using NASA worldwind for my project and created heatmaps using its ProceduralTiledImageLayer. – Jeff Storey Jul 22 '10 at 01:28
-
@JeffStorey is there any sample we can use? – Riyas Aug 22 '18 at 09:41
6 Answers
4
This seems possible.
For instance, take a look at those few links :
Disclaimer : I've tried none of those
- HeatMapAPI.com
- And an example
- But I'm not sure how you'd do it ; seems related to .NET and a dll in some way... so might not be as nice as it seems...
- Density Mapping in Google Maps with HeatMapAPI
- Heat Maps for Google Maps - (a.k.a GeoIQ mashup)
- Using Google Maps to Produce Heat Maps
You've got a couple of links in those articles too ; some might be interesting too.
Pascal MARTIN
- 395,085
- 80
- 655
- 663
-
1Thanks. I had seen most of these links - it looks like most of them are geared toward either web pages or .NET. I should have specified I'm trying to do this in the thick client application. My best hope might be to write my own heat map algorithm and then generate an overlay for google earth. – Jeff Storey Aug 03 '09 at 22:54
-
Ho :-( might be a bit harder, then :-( Anayway, if you find a nice solutionn, don't forget telling about it here : might help people arriving here seeing your question ! Good luck ! – Pascal MARTIN Aug 04 '09 at 04:10
-
I ended up creating a heatmap on a transparent image. Google earth uses a simple cylindrical projection so it's pretty easy to calculate latitude and longitude points based on the map size. My heatmap isn't perfect, but basically I just plotted a point at each location and blended close points together to create a "brighter" point. Thanks! – Jeff Storey Aug 05 '09 at 12:08
-
-
The heatmap api is ridiculous! Just so they can place their logo relative to the map view, any time the user drags the heatmap it is recomputed (on their server), transmitted and redrawn! In addition you need a key/token! – Lorenz Lo Sauer Sep 28 '11 at 14:28
4
My colleague developed an open source java program that will generate 3D heat maps (KML) files for Google Earth from simply formatted XML data files. It may be of use. The entire project code is up at https://github.com/Noblis/OSAT You can ignore the bulk of what's there, and focus on GUIMain and the supporting files. There's sample files and documentation. I'd call it about a 0.5 version - it works, we used it in our studies, but there's some rough edges. It was done for transportation accessibility studies, but you can change the parameters you're graphing to anything you want, run from command line, whatever.
You can use the vertical axis to either view the same parameter as is used for the color OR use it to map an entirely different variable.
Here's two screen shots so you can see what it does:
tool interface: 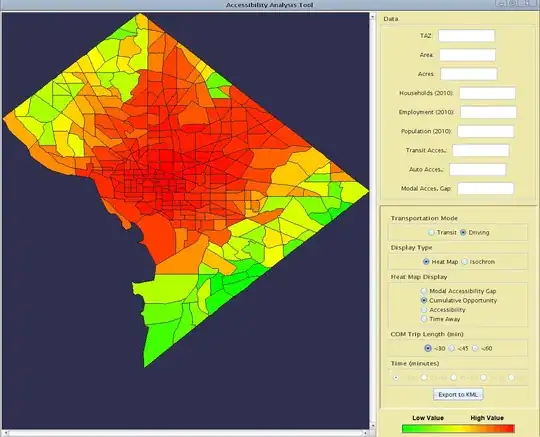
example 3D output: 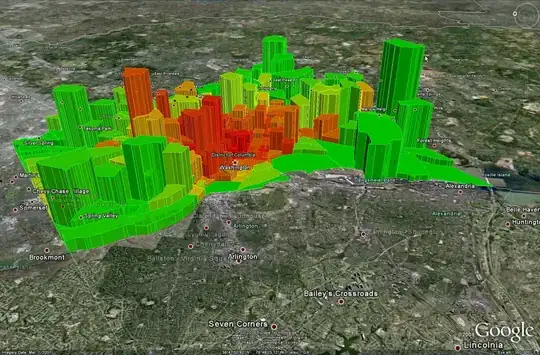
ViennaMike
- 2,207
- 1
- 24
- 38
-
The Sample Output directory of this project includes KML files, but they're not actually KML... they're HTML. They can't be loaded in to Google Earth, and in fact, they're not even valid XML. https://github.com/Noblis/OSAT/tree/master/Sample%20Output – Stealth Rabbi Aug 17 '15 at 15:06
-
Stealth Rabbi: which files specifically are you talking about? I just downloaded DC%20MAG%20vs.%20households.kml and opened it in Google Earth and viewed it just fine. The other .kml files also all look like valid kml when I opened them. They certainly not HTML. – ViennaMike Aug 17 '15 at 16:11
-
Yes, that is one that I tried. Error on line 5, Unexpected element "html". The very first line of the file that isn't whitespace is – Stealth Rabbi Aug 17 '15 at 17:10
-
Oh, crap, I was right clicking on the KML file link that I mentioned and doing a "Save As", and it was all this github link redirection crap. My apologies. – Stealth Rabbi Aug 17 '15 at 17:11
1
You can create polygons in a KML file and set the color of them. You can also make the polygons 3D, with height perhaps representing temperature.
Gary Kephart
- 4,860
- 5
- 39
- 52
1
There is also http://www.openheatmap.com, which offers free heatmaps on top of OpenStreetMap from a CSV upload.
odo
- 31
- 3
0
HeatmapTool.com can take a CSV file of coordinates and intensity values to generate heat map tiles for Google Maps.
0
Try free API heat maps. A really interesting implementation : http://en.tixik.com/tools/heatmaps
rozsypal
- 51
- 4