50

I have a loop where i create some plots and I need unique marker for each plot. I think about creating function, which returns random symbol, and use it in my program in this way:

for i in xrange(len(y)):
    plt.plot(x, y [i], randomMarker())

but I think this way is not good one. I need this just to distinguish plots on legend, because plots must be not connected with lines, they must be just sets of dots.

Trenton McKinney
  • 56,955
  • 33
  • 144
  • 158
user983302
  • 1,377
  • 3
  • 14
  • 23

5 Answers5

89

itertools.cycle will iterate over a list or tuple indefinitely. This is preferable to a function which randomly picks markers for you.

Python 2.x

import itertools
marker = itertools.cycle((',', '+', '.', 'o', '*')) 
for n in y:
    plt.plot(x,n, marker = marker.next(), linestyle='')

Python 3.x

import itertools
marker = itertools.cycle((',', '+', '.', 'o', '*')) 
for n in y:
    plt.plot(x,n, marker = next(marker), linestyle='')

You can use that to produce a plot like this (Python 2.x):

import numpy as np
import matplotlib.pyplot as plt
import itertools

x = np.linspace(0,2,10)
y = np.sin(x)

marker = itertools.cycle((',', '+', '.', 'o', '*')) 

fig = plt.figure()
ax = fig.add_subplot(111)

for q,p in zip(x,y):
    ax.plot(q,p, linestyle = '', marker=marker.next())
    
plt.show()

Example plot

Community
  • 1
  • 1
Mr. Squig
  • 2,755
  • 17
  • 10
  • 1
    +1'ed since this shows a nice way how this can work with an arbitrary number of plots. Same method works with colors etc. – Benjamin Bannier Oct 26 '12 at 18:45
  • 3
    +1 Never knew about the itertools.cycle. Much better than the half-baked lambda/modulo schemes I've used before. – Chris Zeh Oct 26 '12 at 19:22
  • 27
    Just a note for those using Python 3.x, itertools.cycle.next has been changed to next(itertools.cycle()). See http://stackoverflow.com/questions/5237611/itertools-cycle-next – captain_M Sep 17 '14 at 22:27
15

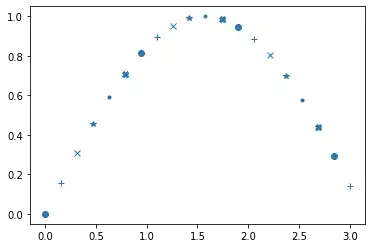
It appears that nobody has mentioned the built-in pyplot method for cycling properties yet. So here it is:

import numpy as np
import matplotlib.pyplot as plt
from cycler import cycler

x = np.linspace(0,3,20)
y = np.sin(x)

fig = plt.figure()
plt.gca().set_prop_cycle(marker=['o', '+', 'x', '*', '.', 'X']) # gca()=current axis

for q,p in zip(x,y):
    plt.plot(q,p, linestyle = '')

plt.show()

Marker cycle only

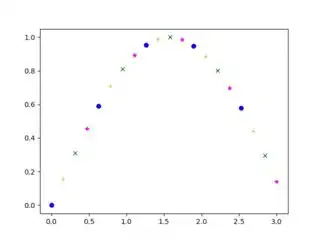
However, this way you lose the color cycle. You can add back color by multiplying or adding a color cycler and a marker cycler object, like this:

fig = plt.figure()

markercycle = cycler(marker=['o', '+', 'x', '*', '.', 'X'])
colorcycle = cycler(color=['blue', 'orange', 'green', 'magenta'])
# Or use the default color cycle:
# colorcycle = cycler(color=plt.rcParams['axes.prop_cycle'].by_key()['color'])

plt.gca().set_prop_cycle(colorcycle * markercycle) # gca()=current axis

for q,p in zip(x,y):
    plt.plot(q,p, linestyle = '')

plt.show()

Marker and color cycle combined by multiplication

When adding cycles, they need to have the same length, so we only use the first four elements of markercycle in that case:

plt.gca().set_prop_cycle(colorcycle + markercycle[:4]) # gca()=current axis

Marker and color cycle combined by addition

paleonix
  • 2,293
  • 1
  • 13
  • 29
Fritz
  • 1,293
  • 15
  • 27
  • 3
    It seems that one does not need to import the `cycler` module and can instead use `plt.cycler` for the same purpose. E.g. `mycyler = plt.cycler(marker=['o', '+'], color=['blue', 'orange'])` and then use it in the `set_prop_cycle()` method as usual. – Ombrophile Apr 11 '21 at 10:36
  • 1
    It may be worth mentioning that on can also "add" cyclers to get a cycler which changes multiple properties aech time. – paleonix Apr 22 '21 at 17:57
  • @PaulG. Feel free to add an example, if you like. – Fritz Apr 23 '21 at 07:54
  • @Fritz As my own answer? I think yours is good enough. I just think adding them is an important feature for creating plots that work for colorblind people or when printed in grayscale. If you need to multiply cyclers to get enough different styles, chances are high that you are trying to put too much information into one plot ;) – paleonix Apr 23 '21 at 11:39
  • 1
    @PaulG. I meant as an edit. I try to follow Wikipedia's 'Be Bold' policy when improving posts (just making the improvement myself instead of suggesting it). – Fritz Apr 24 '21 at 20:13
  • @Fritz While I like the idea (and have added an edit), I don't want to figure out your matplotlibrc. Therefore my example looks different and you might want to redo it. Should I just have redone all pictures? :D – paleonix Apr 25 '21 at 13:14
  • 1
    @PaulG. That's great. No need for perfectionism here. :-) – Fritz Apr 26 '21 at 16:08
  • Great answer! Thanks! – Dash83 Jan 05 '22 at 16:53
9

You can also use marker generation by tuple e.g. as

import matplotlib.pyplot as plt
markers = [(i,j,0) for i in range(2,10) for j in range(1, 3)]
[plt.plot(i, 0, marker = markers[i], ms=10) for i in range(16)]

See Matplotlib markers doc site for details.

In addition, this can be combined with itertools.cycle looping mentioned above

DomQ
  • 4,184
  • 38
  • 37
Pavel Prochazka
  • 695
  • 8
  • 13
  • I like this answer because it allows you to increase the diversity of the markers by increasing the number in the range. Nevertheless, it is not working in v2.0.2 as the first number is the triple should be integer: `(numsides, style, angle)`. I would correct to: `n = 16` and `markers = [(2+i, 1+i%2, i/n*90.0) for i in range(1, n)]`. – Kyr Sep 17 '17 at 16:03
0
import matplotlib.pyplot as plt
fig = plt.figure()
markers=['^', 's', 'p', 'h', '8']
for i in range(5):
    plt.plot(x[i], y[i], c='green', marker=markers[i])
    plt.xlabel('X Label')
    plt.ylabel('Y Label') 
plt.show()
  • 3
    Hi, welcome to Stack Overflow. When answering a question that already has many answers, please be sure to add some additional insight into why the response you're providing is substantive and not simply echoing what's already been vetted by the original poster. This is especially important in "code-only" answers such as the one you've provided. – chb Feb 23 '19 at 02:21
-1

Just manually create an array that contains marker characters and use that, e.g.:

 markers=[',', '+', '-', '.', 'o', '*']
Bitwise
  • 7,577
  • 6
  • 33
  • 50
  • 1
    Hm, how do you exactly "use that"? When I try `ax.plot(t,s, marker=['s', 'o'], ...)`, I get `TypeError: unhashable type: 'list'` – sdaau May 22 '13 at 11:56
  • 1
    This is similar to the ideas above, i.e. cycling over a predefined predefined list. I was not suggesting it can be supplied as a flag to plot(). – Bitwise May 22 '13 at 15:44