271

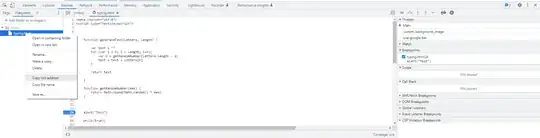
When stepping through JavaScript code in Google Chrome debugger, how do I terminate script execution if I do not want to continue? The only way I found is closing the browser window.

Pressing "Reload this page" runs the rest of the code and even submits forms as if pressing F8 "Continue".

UPDATE:

When pressing F5 (Refresh) while a script is paused:

  • Google Chrome (v22) runs the script. If the script submits HTTP request, the HTTP response for that request is displayed. The original page is not refreshed.
  • IE 9 just freezes. However IE has an option "Stop Debugging" which, when pressed (provided you did not press F5 earlier), continues to run the script outside debugger.
  • Firebug behaves identically to Chrome.

Closing and then opening again the browser window is not always the next easiest way because it will kill browser session state and that may be important. All your breakpoints are also lost.

UPDATE (Jan 2014):

Refresh while debugging:

  • Chrome v31: lets scripts to run and stops on further breakpoints (but does not submit ajax requests), then refreshes.
  • IE 11: refresh does nothing, but you can press F5 to continue.
  • Firefox v26: lets scripts to run but does not stop on further breakpoints, submits ajax requests, then refreshes.

Kind of progress!

Navigate to the same page while debugging:

  • Chrome v31: same as Refresh.
  • IE 11: scripts are terminated, new browser session is started (same as closing and opening again).
  • Firefox v26: nothing happens.

Also juacala suggested an effective workaround. For example, if you are using jQuery, running delete $ from console will stop execution once any jQuery method is encountered. I have tested it in all above browsers and can confirm it is working.

UPDATE (Mar 2015):

Finally, after over 2 years and almost 10K views, the right answer was given by Alexander K. Google Chrome has its own Task Manager which can kill a tab process without closing the tab itself, keeping all the breakpoints and other stuff intact.

I even went as far as BrowserStack.com to test it in Chrome v22 and found that this was working this way even at that time.

Juacala's workaround is still useful when debugging in IE or Firefox.

UPDATE (Jan 2019):

Chrome Dev Tools at last added a proper way to stop script execution which is nice (although a bit hidden). Refer to James Gentes's answer for details.

Mohammad
  • 1,930
  • 1
  • 21
  • 31
srgstm
  • 3,649
  • 2
  • 24
  • 26
  • 14
    type `debugger;` into the dev tools console and it will immediately put things into debugger and stop the script. – Jake Apr 16 '15 at 01:42
  • 4
    James Gentes's answer seems to be a better solution in 2019 – Spikolynn Jan 16 '19 at 14:40
  • 1
    Why is everyone talking about stopping the script? This is about terminating/breaking all "following/sceduled" code to come. – Andre Elrico Oct 02 '19 at 13:46
  • Agreed Andre: For folks who wish to terminate current execution of Javascript without losing a window - Dan Dascalescu below has the answer. – redevill Sep 26 '20 at 21:00

12 Answers12

207

In Chrome, there is "Task Manager", accessible via Shift+ESC or through

Menu → More Tools → Task Manager

You can select your page task and end it by pressing "End Process" button.

Evan Carroll
  • 78,363
  • 46
  • 261
  • 468
Alexander K
  • 2,558
  • 1
  • 16
  • 11
  • 4
    `chrome 48` this will only CLOSE the Dev tool, and not terminate it, reopening it, you can see the program still running (`tried setInterval()`) – Abdelouahab Feb 25 '16 at 14:09
  • 13
    I don't see "Task Manager" under "More Tools" and shift+esc does nothing... (Chrome 50, OSX) Shift+ESC does work under Chrome/Windows though... – Michael Jun 02 '16 at 19:14
  • 2
    Wow—I've wanted this for so long, and it's been there for years! This is the most helpful StackOverflow answer I've seen all year! – Michael Scheper Oct 31 '16 at 20:04
  • this doesn't seem to work quite properly when the process is a remote debugging session – Michael Dec 30 '16 at 20:04
  • 1
    Note that using the Task Manager to end the process will make the DOM and scripts unavailable for the page (it kills the whole page). If you want the page to remain rendered and scripts to remain available, you'll have to stop the script using an error (see my answer). A clever enough error will keep the page fully functional; it will just stop whatever bad loop you happen to be in. – juacala Apr 17 '17 at 17:26
  • If you terminate a Chrome extension (they all show up in the Task Manager), you'll get a balloon saying the extension has crashed. You'll need to click that message to reload the extension so you can continue debugging it. – jdunning Jul 20 '17 at 01:46
  • 6
    On Macintosh (Chrome v.63) this option shows under the "Window" menu, in the third group. There is no keyboard shortcut evident. – Apollo Jan 10 '18 at 16:24
  • 3
    This will kill the tab – htafoya May 29 '18 at 00:33
  • James Gentes' answer from 2018 is the simpler solution now. – Spikolynn Jan 16 '19 at 14:39
  • this will close dev tools for me and continues the script. – Andre Elrico Oct 02 '19 at 13:46
  • How does this answer have so many upvotes? It's terrible for a few reasons: 1) It KILLs the tab, not just stop the script so you could continue interacting with the page. 2) It kills OTHER TABS from the same domain that share the process. 3) If you have many tabs open, it's not easy to find the one you want to kill. – Dan Dascalescu Mar 31 '20 at 13:18
  • The CPU is still at 100% even when the process is killed https://imgur.com/yKb2qNi (Chrome 86.0.4240.193) –  Nov 11 '20 at 18:41
155

As of April 2018, you can stop infinite loops in Chrome:

  1. Open the Sources panel in Developer Tools (Ctrl+Shift+I**).
  2. Click the Pause button to Pause script execution.

Also note the shortcut keys: F8 and Ctrl+\

enter image description here

ROOT
  • 11,363
  • 5
  • 30
  • 45
James Gentes
  • 7,528
  • 7
  • 44
  • 64
  • 2
    Such a hidden gem on that UI. – Sam R. May 17 '19 at 20:37
  • 1
    The answerer has a key to the secrets of the Universe. – Sam Oct 28 '19 at 22:24
  • The shortcut is particularly useful when you have an endlessly running script you want to stop to check the console. Thanks. – Alexei - check Codidact Mar 15 '20 at 09:28
  • @DanDascalescu I have Chrome 80.0.3987.149 and it looks the same – James Gentes Mar 31 '20 at 17:48
  • Maybe we're looking at the button in different states of execution? Mine is that I picked the `body` element here on SO, set a "break on -> subtree modifications", then clicked wherever. The button looks like in the screenshot I posted. – Dan Dascalescu Apr 01 '20 at 09:34
  • Interesting, I just hit F12, go to the Sources tab, and the pause button is right there. It's also important to note that the shortcut keys remain the same, so probably inaccurate to say this no longer works – James Gentes Apr 01 '20 at 13:05
  • that button in node debugging is just to pause on exceptions – SuperUberDuper Aug 08 '20 at 10:40
  • 3
    In my case, that is using requestAnimationFrame(), Chrome keeps working so the CPU usage is at 100% regardless the script is paused. –  Nov 11 '20 at 17:50
  • This *pauses* code execution. When you hit a breakpoint, the code pauses and you enter debug mode. Thus, in debug mode, the code is already paused. How do you *terminate* the paused thread? – Travis Bemrose Mar 28 '23 at 15:42
  • @TravisBemrose that would make for a good new question on SO :) – James Gentes Mar 28 '23 at 17:12
  • @JamesGentes NEW question? That's literally a restatement of *this* question, which doesn't seem to have a good answer. People are answering 'how to pause' execution or 'how to enter debug mode'. The question is how to *exit* debug mode without resuming. – Travis Bemrose Apr 25 '23 at 13:38
98

2020 April update

As of Chrome 80, none of the current answers work. There is no visible "Pause" button - you need to long-click the "Play" button to access the Stop icon:

Stop script execution in Chrome DevTools

Dan Dascalescu
  • 143,271
  • 52
  • 317
  • 404
39

One way you can do it is pause the script, look at what code follows where you are currently stopped, e.g.:

var something = somethingElse.blah;

In the console, do the following:

delete somethingElse;

Then play the script: it will cause a fatal error when it tries to access somethingElse, and the script will die. Voila, you've terminated the script.

EDIT: Originally, I deleted a variable. That's not good enough. You have to delete a function or an object of which JavaScript attempts to access a property.

Ulf Gjerdingen
  • 1,414
  • 3
  • 16
  • 20
juacala
  • 2,155
  • 1
  • 21
  • 22
  • 3
    ```you have to delete a function or an object``` such a nasty hack! (in the UI it would fit nicely as *kill all* button) – Mars Robertson Jul 02 '14 at 05:19
  • It is pretty nasty, but I can't think of another way. – juacala Jan 23 '15 at 18:50
  • Year later I'm returning to the same question... And I cannot figure it out! Is there a way to make it more generic? – Mars Robertson Jul 14 '15 at 17:00
  • You can't figure out how to terminate the script execution? I've always been able to do this. Do you have an example that doesn't let you kill the script this way? – juacala Jul 14 '15 at 21:28
  • I do, @juacala, if you wouldn't mind helping me with it. I'm running a simple script that automatically clicks the See Older Messages link on a Facebook message thread. This is the whole of the code: `setInterval(function () { document.getElementById('see_older') .getElementsByClassName('content')[0].click(); }, 250);` How would I kill that script using your method? I'm no newbie to JavaScript, but completely new to the consoles, and would really appreciate any help. – Hashim Aziz Oct 05 '15 at 19:33
  • 1
    @Hashim, you need to be able to put a break point inside the function. So make sure that the inside of the function is on a separate line from the function definition. In your case, you'll need to in the console, once it's paused, type "document.getElementById('see_older').parentNode.removeChild(document.getElementById('see_older'));". This is because you don't have anything in javascript to break on. Unfortunately, this changes the HTML too. If you can change the code to "var el = document.getElementById('see_older');\n el.getEl..." then you can just do "delete el;" and that will stop it. – juacala Oct 08 '15 at 01:01
  • I landed here looking for a way to do this in Firefox - this answer did the trick. – user1205577 May 26 '16 at 19:34
9

[2022 edit: this was reported as https://bugs.chromium.org/p/chromium/issues/detail?id=774852 and https://bugs.chromium.org/p/chromium/issues/detail?id=1112863 in 2017, and was just recently marked as fixed 5 years later, so if you are still experiencing this, you should update Chrome (and in general keep it updated). If you are experiencing this issue in 2023 or forward, it may be a different issue, a bug regression, etc.]

If you are encountering this while using the debugger statement,

debugger;

... then I think the page will continue running forever until the js runtime yields, or the next break. Assuming you're in break-on-error mode (the pause-icon toggle), you can ensure a break happens by instead doing something like:

debugger;throw 1;

or maybe call a non-existent function:

debugger;z();

(Of course this doesn't help if you are trying to step through functions, though perhaps you could dynamically add in a throw 1 or z() or somesuch in the Sources panel, ctrl-S to save, and then ctrl-R to refresh... this may however skip one breakpoint, but may work if you're in a loop.)

If you are doing a loop and expect to trigger the debugger statement again, you could just type throw 1 instead.

throw 1;

Then when you hit ctrl-R, the next throw will be hit, and the page will refresh.

(tested with Chrome v38, circa Apr 2017)

ninjagecko
  • 88,546
  • 24
  • 137
  • 145
5

Refering to the answer given by @scottndecker to the following question, chrome now provides a 'disable JavaScript' option under Developer Tools:

  • Vertical ... in upper right (in Developer Tools menu, not in Chrome main menu)
  • Settings (in newer Chrome versions it is visible separately as a cogwheel besides the ... button, not under it)
  • And under 'Preferences' go to the 'Debugger' section at the very bottom and select 'Disable JavaScript'

Good thing is you can stop and rerun again just by checking/unchecking it.

Roland Pihlakas
  • 4,246
  • 2
  • 43
  • 64
theFreedomBanana
  • 2,462
  • 2
  • 22
  • 29
4

Good question here. I think you cannot terminate the script execution. Although I have never looked for it, I have been using the chrome debugger for quite a long time at work. I usually set breakpoints in my javascript code and then I debug the portion of code I'm interested in. When I finish debugging that code, I usually just run the rest of the program or refresh the browser.

If you want to prevent the rest of the script from being executed (e.g. due to AJAX calls that are going to be made) the only thing you can do is to remove that code in the console on-the-fly, thus preventing those calls from being executed, then you could execute the remaining code without problems.

I hope this helps!

P.S: I tried to find out an option for terminating the execution in some tutorials / guides like the following ones, but couldn't find it. As I said before, probably there is no such option.

http://www.codeproject.com/Articles/273129/Beginner-Guide-to-Page-and-Script-Debugging-with-C

http://www.nsbasic.com/app/tutorials/TT10.htm

  • Did I help? It seems that there is not a terminate option, but in order to prevent the execution of the following code you can either comment it before or delete the following code/call "live" within the Chrome debugger (this latter option will make the continue button behave like a terminate). I know they are not ideal solutions, but I think they are the most acceptable ones. Any comments? – Romén Rodríguez-Gil Oct 30 '12 at 13:54
  • 1
    In many cases, the code that needs to be prevented from executing is up the call stack (the functions which will get control after the current function returns). Sure, I can go and edit functions up the call stack, and then find and edit all functions which might be called asynchronously. I am sure, it must be a trivial thing for a browser to refresh a page with the script still in the paused state IF it was paused at the time the Page Refresh button was pressed. I also think that it should be an expected behavior for any browser (unfortunately, it's not). – srgstm Oct 31 '12 at 04:54
  • 2
    Actually I found a workaround to achieve the termination of the script execution!: In chrome, I open the debugger to debug one of my applications and I set a breakpoint. I run the page. The execution pauses at the breakpoint. Then I examine the problem and realize what is causing the bug. **To terminate the execution** I click in the X button next to the URL (to stop the page loading) and then, when continuing the script (F8) it will terminate. Rather easy way to achieve it, I think. What do you think about this one? – Romén Rodríguez-Gil Oct 31 '12 at 13:13
  • The X button in Chrome is replaced with Refresh button after a page has loaded so there is no way to press X afterwards (I have also tried it in IE which does have X available all the time, but it invariably freezes). I have also tested your suggestion during page load and found that the script does not terminate after pressing X and then F8. It's likely that the scripts that have not been yet loaded into the browser at the time X was pressed are not loaded afterwards but that should be evident. – srgstm Oct 31 '12 at 17:13
  • Oh you are right, it was a quick test and was non-representative... Then it seems that there is no solution. – Romén Rodríguez-Gil Oct 31 '12 at 18:23
  • F8 means "resume execution". So if the script is not stopped by an exception, it will continue from the current line. – Kent Jun 06 '13 at 20:30
  • [Yes you can](https://stackoverflow.com/questions/13134723/how-to-terminate-script-execution-when-debugging-in-google-chrome/60951463#60951463). – Dan Dascalescu Mar 31 '20 at 13:19
2

You can pause on any XHR pattern which I find very useful during debugging these kind of scenarios.

For example I have given breakpoint on an URL pattern containing "/"

enter image description here

Liam
  • 2,837
  • 23
  • 36
0

If you have a rogue loop, pause the code in Google Chrome debugger (the small "||" button while in Sources tab).

Switch back to Chrome itself, open "Task Manager" (Shift+ESC), select your tab, click the "End Process" button.

You will get the Aww Snap message and then you can reload (F5).

As others have noted, reloading the page at the point of pausing is the same as restarting the rogue loop and can cause nasty lockups if the debugger also then locks (in some cases leading to restarting chrome or even the PC). The debugger needs a "Stop" button. Nb: The accepted answer is out of date in that some aspects of it are now apparently wrong. If you vote me down, pls explain :).

ROOT
  • 11,363
  • 5
  • 30
  • 45
www-0av-Com
  • 707
  • 10
  • 14
  • 1
    There's a [better way](https://stackoverflow.com/questions/13134723/how-to-terminate-script-execution-when-debugging-in-google-chrome/60951463#60951463). – Dan Dascalescu Mar 31 '20 at 13:20
0
  1. Go to the Sources tab and select Filesystem subTab

Add folder screenshot

  1. Select a folder, containing the file you execute
  2. Accept folder access recuest
  3. Select the file you execute

Select file screenshot

  1. Put a breakpoint inside the file you execute
  2. Click the "Pause script execution option"

Breakpoint and pause screenshot

  1. Select the copy link address option in the RMB context menu

Copy link address screenshot

  1. Paste the copied address into the browser address bar to open the file
  2. File execution will be stopped at the breakpoint
Willie Cheng
  • 7,679
  • 13
  • 55
  • 68
-1

Open the source tab in 'Developer Tools', click on a line number in a script that is running, this will create a breakpoint and the debugger will break there.

Todd
  • 97
  • 1
  • 6
-1

There are many appropiate solution to this problem as mentioned above in this post, but i have found a small hack that can be inserrted in the script or pasted in the Chromes console (debugger) to achieve it:

jQuery(window).keydown(function(e) { if (e.keyCode == 123) debugger; });

This will cause execution to be paused when you hit F12.

Murtaza Hussain
  • 3,851
  • 24
  • 30