1

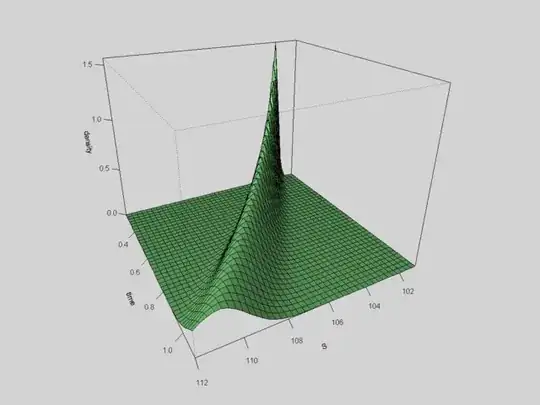
I am talking about this picture:

Questions:

This is R, not Matlab right? Below the page it says it was made with R....

How can I do this? I mean, how can I create such a 3d scatterplot with this advanced green surface and this grid? I now how to make simple scatterplots and also 3d scatterplots, but how can I create such an advanced picture? Which package is this?

I want to include it in a paper where this picture should rotate automatically. I know how to include this into my tex-distribution, but therefore I need single png. So e.g. 1000 single pictures which I animate. But how can I get those with R? I would need to rotate it and then save every single small rotation as a graphic file.

Thanks a lot for your help, my biggest problems are the creation of this graphic (packages?) and how to make it rotate (r code?)

Community
  • 1
  • 1
user1690846
  • 255
  • 1
  • 2
  • 11
  • 1
    It looks like they fixed the rgl package to dump a .png file. The last time I tried this package, it would display the graph on the screen (and I could rotate it, zoom in/out, etc) but it wouldn't dump the image to a file. It looks like the new version (0.92.894 2012-10-22) fixed that. – bill_080 Nov 14 '12 at 20:22
  • When this question was migrated, @nico 's comment was lost. Here's his link: http://stackoverflow.com/questions/3979240/r-plotting-a-3d-surface-from-x-y-z Here's the link from my comment above: http://stackoverflow.com/questions/4543272/rgl-snapshot-no-longer-works – bill_080 Nov 14 '12 at 22:42

1 Answers1

6
  1. To create this figure, you might check out persp function. You can change the parameter to rotate the figure. Here's one demo:

    require(grDevices) # for trans3d
    x <- seq(-10, 10, length= 30)
    y <- x
    f <- function(x,y) { r <- sqrt(x^2+y^2); 10 * sin(r)/r }
    z <- outer(x, y, f)
    z[is.na(z)] <- 1
    persp(x, y, z, theta = 90, phi = 30, expand = 0.5, col = "lightgreen")
    

enter image description here

When change theta = 30:

persp(x, y, z, theta = 30, phi = 30, expand = 0.5, col = "lightgreen")

enter image description here

  1. For color, you can type colors() to see what color you can use. Currently, I found lightgreen might be the closest color you want.
liuminzhao
  • 2,385
  • 17
  • 28
  • ok, first of all: A big thanks for the answers. But I have more questions: 1. I need to save different e.g. png files with different angels (different rotation) so that I can join them to a movie, can I do this with rgl package? @liuminzhao the theta is for left and right, so the phi is for up and down? I want to save single small rotations steps as a picture and join them to a movie/anim.. How can I do this? Also I do not have a function, I have empirical data, e.g. I want to have a Black Scholes Plot of Vega dependend on asset price and time to maturity. Thanks a lot again for your help! – user1690846 Nov 15 '12 at 17:32
  • oh and one more question: How can I have fancy colors, that extreme values are red and then a smooth color change into e.g. blue for low values? So not discrete changes but continious? Thanks a lot @bill_080 and liuminzhao – user1690846 Nov 15 '12 at 17:45
  • 1. not familiar with `rgl` package. 2. I think so about `phi` 3. You might try a `for` loop plotting a bunch of png and make them a gif? try `animation` package ? 4. I think empirical data is fine, once you have `z` value corresponding to its coordinates `(x, y)`. – liuminzhao Nov 15 '12 at 17:51
  • For colors, still check out `help(persp)`. In example 4, # (4) Surface colours corresponding to z-values. Is that what you are looking for? – liuminzhao Nov 15 '12 at 17:56
  • Also check out the animation package in R. This speaks to a programme like ImageMagick and makes it easy to turn your images into a movie or animated gif. – Peter Ellis Nov 23 '12 at 20:54