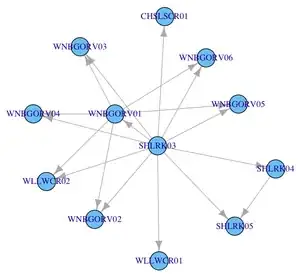
I'm trying to plot/sketch (matplotlib or other python library) a 2D network of a big distance matrix where distances would be the edges of the sketched network and the line and column its nodes.
DistMatrix =
[       'a',   'b',     'c',    'd'],
['a',   0,      0.3,    0.4,    0.7],
['b',   0.3,    0,      0.9,    0.2],
['c',   0.4,    0.9,    0,      0.1],
['d',   0.7,    0.2,    0.1,    0] ]
I'm searching to sketch/plot the 2d network from such (bigger: thousand of columns and lines) distance matrix: node 'a' is linked to node 'b' by an edge depth of 0.3, nodes 'c' and 'd' would be tied by an edge depth of 0.1. What are the tools/libraries I can used (distance matrix can be converted into numpy matrix) to get the sketch/graphical projection of such network? (pandas, matplotlib, igraph,...?) and some leads to do that quickly (I would not define my self Tkinter function to do that ;-) ) ? thanks for your incoming answers.