When I plot two graphs after creating a new x11() device and want to set a overall title it is not displayed well. The top part of the title string is behind the window top bar. Is there a way to fix this? I couldn't find anything in ?x11 or in the x11 client preferences that helped.
This script:
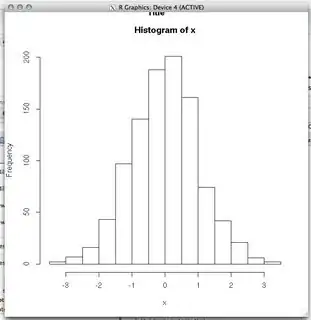
x11()
x <- rnorm(1000, 0, 1)
hist(x)
title('Title', outer = TRUE)
Looks like that: