Is there any possibility to add a label to a specific data point within a WPF toolkit chart? That label should simply show the data point's value. This was quite easy to achieve on iOS (core-plot) and Android, but I couldn't get it to work on Windows Phone. Given the fact that there seems to be no documentation for WPF toolkit/charting doesn't make it much easier.
This is how the data points' labels look on iOS (5.1%, 18.3%)

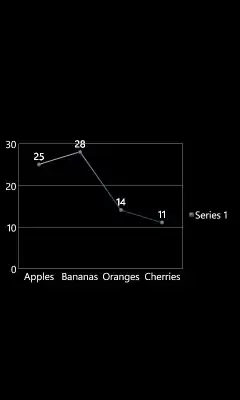
Basically, I'd need the same data-point labeling for the x-values of 12 and 60 on Windows Phone as it is right now on iOS.
Those data-points are visible as green dots in this screenshot (WP 7.1):
Any help would be kindly appreciated. Thank you very much in advance.