import matplotlib.pyplot as plt
fig = plt.figure()
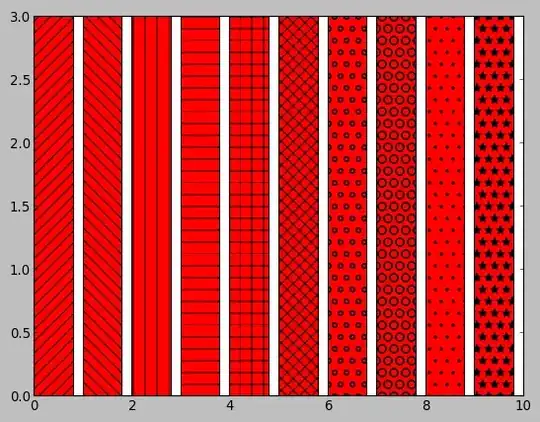
patterns = [ "/" , "\\" , "|" , "-" , "+" , "x", "o", "O", ".", "*" ]
ax1 = fig.add_subplot(111)
for i in range(len(patterns)):
ax1.bar(i, 3, color='red', edgecolor='black', hatch=patterns[i])
plt.show()
It's in the documentation here.
Okay - so to texture a piechart, you need to do this:
if you look here:
Return value:
If autopct is None, return the tuple (patches, texts):

patches is a sequence of matplotlib.patches.Wedge instances
texts is a list of the label matplotlib.text.Text instances.
so then we look at the Wedges page, and see that it has a set_hatch() method.
so we just need to add a few lines to the piechart demo and...
Example 1:
import matplotlib.pyplot as plt

fig = plt.figure()

patterns = [ "/" , "\\" , "|" , "-" , "+" , "x", "o", "O", ".", "*" ]

ax1 = fig.add_subplot(111)
for i in range(len(patterns)):
    ax1.bar(i, 3, color='red', edgecolor='black', hatch=patterns[i])


plt.show()
Example 2:
"""
Make a pie chart - see
http://matplotlib.sf.net/matplotlib.pylab.html#-pie for the docstring.

This example shows a basic pie chart with labels optional features,
like autolabeling the percentage, offsetting a slice with "explode",
adding a shadow, and changing the starting angle.

"""

from pylab import *
import math
import numpy as np

patterns = [ "/" , "\\" , "|" , "-" , "+" , "x", "o", "O", ".", "*" ]


def little_pie(breakdown,location,size):
    breakdown = [0] + list(np.cumsum(breakdown)* 1.0 / sum(breakdown))
    for i in xrange(len(breakdown)-1):
        x = [0] + np.cos(np.linspace(2 * math.pi * breakdown[i], 2 * math.pi *
                          breakdown[i+1], 20)).tolist()
        y = [0] + np.sin(np.linspace(2 * math.pi * breakdown[i], 2 * math.pi *
                          breakdown[i+1], 20)).tolist()
        xy = zip(x,y)
        scatter( location[0], location[1], marker=(xy,0), s=size, facecolor=
               ['gold','yellow', 'orange', 'red','purple','indigo','violet'][i%7])

figure(1, figsize=(6,6))

little_pie([10,3,7],(1,1),600)
little_pie([10,27,4,8,4,5,6,17,33],(-1,1),800)

fracs = [10, 8, 7, 10]
explode=(0, 0, 0.1, 0)

piechart = pie(fracs, explode=explode, autopct='%1.1f%%')
for i in range(len(piechart[0])):
    piechart[0][i].set_hatch(patterns[(i)%len(patterns)])


show()

![Hatched pie chart]](../../images/3819244668.webp)