I'm new to Jfreechart and swing and was trying to create a single graph showing both mean (as line chart) and standard deviation (as whiskers), but failed so far.
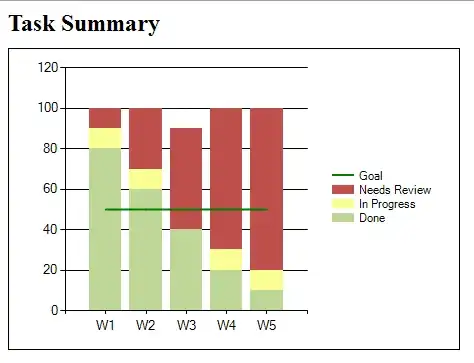
I'm trying to make the graph look similar to that:
I've tried using graph with multiple datasets but failed to make the renderer (xyrenderer) display the whiskers for the standard deviation.
Is there a better way to do this? perhaps some other free package?