9

I would like the following code to produce 4 subplots of the same size with a common aspect ratio between the size of x-axis and y-axis set by me. Referring to the below example, I would like all of the subplots look exactly like the first one (upper left). What is wrong right now is that the size of the y-axis is correlated with its largest value. That is the behaviour I want to avoid.

import matplotlib.pyplot as plt
import numpy as np

def main(): 

    fig = plt.figure(1, [5.5, 3])
    for i in range(1,5):
        fig.add_subplot(221+i-1, adjustable='box', aspect=1) 
        plt.plot(np.arange(0,(i)*4,i))

    plt.show()

if __name__ == "__main__": 
    main()

Surprisingly, matplotlib produces the right thing by default (picture below):

   import  matplotlib.pyplot as plt 
   import numpy as np 

   def main(): 
       fig = plt.figure(1, [5.5, 3]) 
       for i in range(1,5): 
           fig.add_subplot(221+i-1) 
            plt.plot(np.arange(0,(i)*4,i)) 
       plt.show() 

I just want to add to this an ability to control the aspect ratio between lengths of x and y-axes.

Here is what I am looking for:

BartoszKP
  • 34,786
  • 15
  • 102
  • 130
user2077647
  • 93
  • 1
  • 1
  • 5

3 Answers3

10

I can't quite tell what you want from your question.

Do you want all of the plots to have the same data limits?

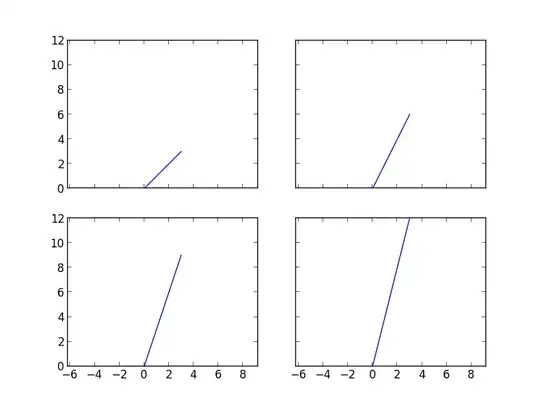
If so, use shared axes (I'm using subplots here, but you can avoid it if you want to stick to matlab-style code):

import matplotlib.pyplot as plt
import numpy as np

fig, axes = plt.subplots(nrows=2, ncols=2, sharey=True, sharex=True)
for i, ax in enumerate(axes.flat, start=1):
    ax.set(aspect=1)
    ax.plot(np.arange(0, i * 4, i))

plt.show()

enter image description here

If you want them all to share their axes limits, but to have adjustable='box' (i.e. non-square axes boundaries), use adjustable='box-forced':

import matplotlib.pyplot as plt
import numpy as np

fig, axes = plt.subplots(nrows=2, ncols=2, sharey=True, sharex=True)
for i, ax in enumerate(axes.flat, start=1):
    ax.set(aspect=1, adjustable='box-forced', xticks=range(i))
    ax.plot(np.arange(0, i * 4, i))

plt.show()

enter image description here


Edit: Sorry, I'm still a bit confused. Do you want something like this?

import matplotlib.pyplot as plt 
import numpy as np 

fig, axes = plt.subplots(nrows=2, ncols=2)
for i, ax in enumerate(axes.flat, start=1):
    ax.set(adjustable='datalim', aspect=1)
    ax.plot(np.arange(0, i * 4, i))

plt.show()

enter image description here


Okay, I think I finally understand your question. We both meant entirely different things by "aspect ratio".

In matplotlib, the aspect ratio of the plot refers to the relative scales of the data limits. In other words, if the aspect ratio of the plot is 1, a line with a slope of one will appear at 45 degrees. You were assuming that the aspect ratio applied to the outline of the axes and not the data plotted on the axes.

You just want the outline of the subplots to be square. (In which case, they all have different aspect ratios, as defined by matplotlib.)

In that case, you need a square figure. (There are other ways, but just making a square figure is far simpler. Matplotlib axes fill up a space that is proportional to the size of the figure they're in.)

import matplotlib.pyplot as plt 
import numpy as np 

# The key here is the figsize (it needs to be square). The position and size of
# axes in matplotlib are defined relative to the size of the figure.
fig, axes = plt.subplots(nrows=2, ncols=2, figsize=(8,8))

for i, ax in enumerate(axes.flat, start=1):
    ax.plot(np.arange(0, i * 4, i))

# By default, subplots leave a bit of room for tick labels on the left.
# We'll remove it so that the axes are perfectly square.
fig.subplots_adjust(left=0.1)

plt.show()

enter image description here

Joe Kington
  • 275,208
  • 71
  • 604
  • 463
  • Hi Joe! Thanks for the attention to my question. I am sorry for the confusion. Neither of your 2 options provides exactly what I am looking for. The first option is the closest though. It would be perfect if each one of subplots had its own limit of y-axis. That is what matplotlib does automatically. For instance, the following: (in the next message) produces the look that I want, but I would also like to control the aspect ratio of those subplots (one aspect ratio for all of them) – user2077647 Feb 16 '13 at 19:38
  • code: import matplotlib.pyplot as plt import numpy as np def main(): fig = plt.figure(1, [5.5, 3]) for i in range(1,5): fig.add_subplot(221+i-1) plt.plot(np.arange(0,(i)*4,i)) plt.show() – user2077647 Feb 16 '13 at 19:41
  • I have added the picture this code produces in my original question – user2077647 Feb 16 '13 at 19:45
  • Hi Joe, almost there! This is perfect except I would like all of the suplots have the x-axes limits to be from 0 to 3. That picture I included in the original question is everything I want but with wrong aspect ratio between axes. So right now it is something like 1/2 but I am looking for 1/1. – user2077647 Feb 17 '13 at 19:18
  • Sorry, I'm still confused... The aspect ratio can't be constant if neither the limits or size of the axes change. You seem to be asking for plots that are the exact same size, have the same aspect ratio, the same x-axis limits, but different y-axis limits. That's impossible, by definition. I think I'm just misunderstanding your question... – Joe Kington Feb 17 '13 at 23:58
  • Hi Joe, thx for hanging on with me! Maybe I am using wrongly the term "aspect ratio". What I mean is the physical ratio (in pixels) between x and y-axes. To explain myself, here what I would do if I just needed to sketch them on a piece of paper by hand. – user2077647 Feb 18 '13 at 03:14
  • In theory, we can always draw 4 rectangles placed on a grid 2 x 2 such that their height/width=aspect_ratio was the same for all of them. Once this is done, it is just the matter of putting labels on the axes. In my case, I want all of them to have [0,1,2,3] on their x-axes (each x-axis goes from 0 to 3). As for y-axes, each limit is different (even thought the physical sizes of all y-axes are the same). So the first y-axis goes from 0 to 3, the 2nd from 0 to 6, the 3rd from 0 to 9 and the 4th one goes from 0 to 12. – user2077647 Feb 18 '13 at 03:15
  • If you take another look at that picture I attached, it satisfies everything I am describing here. The only problem is that I am unable to make all of those suplots to be square for instance. Hope I made myself a bit more clear and once again, thanks a bunch! – user2077647 Feb 18 '13 at 03:18
  • Ah, that explains it! In matplotlib, the aspect ratio of the plot refers to the ratio of the xscale to the yscale of the data and doesn't relate to the height/width of the outline of the plot. You just want subplots with square outlines? If so, see the edit. – Joe Kington Feb 18 '13 at 04:37
  • Yay! that is exactly it! Sorry for the whole headache and thanks a lot! – user2077647 Feb 18 '13 at 05:11
2

Combing the answer of Joe Kington with new pythonic style for shared axes square subplots in matplotlib? and another post that I am afraid I cannot find it again, I made a code for precisely setting the ratio of the box to a given value.

Let desired_box_ratioN indicate the desired ratio between y and x sides of the box. temp_inverse_axis_ratioN is the ratio between x and y sides of the current plot; since 'aspect' is the ratio between y and x scale (and not axes), we need to set aspect to desired_box_ratioN * temp_inverse_axis_ratioN.

import matplotlib.pyplot as plt
import numpy as np

fig, axes = plt.subplots(nrows=2, ncols=2)

desired_box_ratioN = 1
for i, ax in enumerate(axes.flat, start=1):
    ax.plot(np.arange(0, i * 4, i))
    temp_inverse_axis_ratioN = abs( (ax.get_xlim()[1] - ax.get_xlim()[0])/(ax.get_ylim()[1] - ax.get_ylim()[0]) )
    ax.set(aspect = desired_box_ratioN * temp_inverse_axis_ratioN, adjustable='box-forced')

plt.show()
Community
  • 1
  • 1
Dr Fabio Gori
  • 1,105
  • 16
  • 21
1

The theory

Different coordinate systems exists in matplotlib. The differences between different coordinate systems can really confuse a lot of people. What the OP want is aspect ratio in display coordinate but ax.set_aspect() is setting the aspect ratio in data coordinate. Their relationship can be formulated as:

aspect = 1.0/dataRatio*dispRatio

where, aspect is the argument to use in set_aspect method, dataRatio is aspect ratio in data coordinate and dispRatio is your desired aspect ratio in display coordinate.

The practice

There is a get_data_ratio method which we can use to make our code more concise. A work code snippet is shown below:

import matplotlib.pyplot as plt
import numpy as np

fig, axes = plt.subplots(nrows=2, ncols=2)

dispRatio = 0.5
for i, ax in enumerate(axes.flat, start=1):
    ax.plot(np.arange(0, i * 4, i))
    ax.set(aspect=1.0/ax.get_data_ratio()*dispRatio, adjustable='box-forced')

plt.show()

I have also written a detailed post about all this stuff here.

jdhao
  • 24,001
  • 18
  • 134
  • 273
  • I have tried to follow your tutorial, which is very clear, however, it does not work when the y-axis has a log scale, any ideas on widening the x-axis while keeping y-axis on log scale? – seanysull Feb 19 '19 at 15:05
  • Sorry, I am not sure. Maybe you can open a new question here on Stack Overflow based on that post. – jdhao Feb 19 '19 at 16:47