We have lately added DirectSound-based audio data input routines in LightningChart data visualization library. LightningChart SDK is set of components for Visual Studio .NET (WPF and WinForms), you may find it useful.
With AudioInput component, you can get real-time waveform data samples from sound device. You can play the sound from any source, like Spotify, WinAmp, CD/DVD player, or use mic-in connector.
With SpectrumCalculator component, you can get power spectrum (FFT conversion) that is handy in many visualizations.
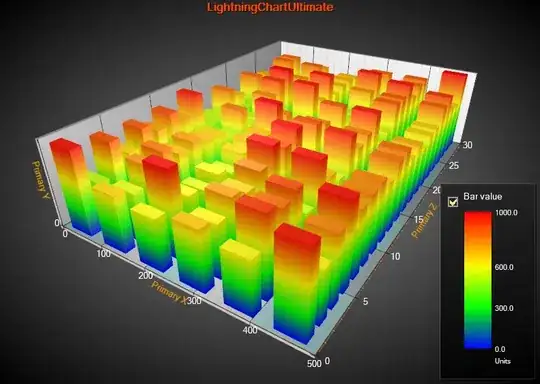
With LightningChartUltimate component you can visualize data in many different forms, like waveform graphs, bar graphs, heatmaps, spectrograms, 3D spectrograms, 3D lines etc. and they can be combined. All rendering takes place through Direct3D acceleration.
Our own examples in the SDK have a scientific approach, not really having much entertainment aspect, but it definitely can be used for awesome entertainment visualizations too.
We have also configurable SignalGenerator (sweeps, multi-channel configurations, sines, squares, triangles, and noise waveforms, WAV real-time streaming, and DirectX audio output components for sending wave data out from speakers or line-output.

 [I'm CTO of LightningChart components, doing this stuff just because I like it :-) ]