41

How do I change the border width of a subplot?

Code is as follows:

fig = plt.figure(figsize = (4.1, 2.2))
ax = fig.add_subplot(111)

ax.patch.set_linewidth(0.1) 
ax.get_frame().set_linewidth(0.1) 

The last two lines do not work, but the following works fine:

legend.get_frame().set_ linewidth(0.1)
cottontail
  • 10,268
  • 18
  • 50
  • 51
aaa
  • 411
  • 1
  • 4
  • 3

4 Answers4

39

Maybe this is what you are looking for?

import matplotlib as mpl

mpl.rcParams['axes.linewidth'] = 0.1 #set the value globally

Timothy Dalton
  • 1,290
  • 2
  • 17
  • 24
37

You want to adjust the border line size? You need to use ax.spines[side].set_linewidth(size).

So something like:

[i.set_linewidth(0.1) for i in ax.spines.itervalues()]
Mark
  • 106,305
  • 20
  • 172
  • 230
  • 4
    In more recent matplotlib it seems ax.spines has no `itervalues` nor `set_linewidth` properties – CPBL Jan 09 '22 at 16:06
7

This worked for me [x.set_linewidth(1.5) for x in ax.spines.values()]

Vulwsztyn
  • 2,140
  • 1
  • 12
  • 20
0

If one or more properties of an Artist need to be set to a specific value, matplotlib has a convenience method plt.setp (can be used instead of a list comprehension).

plt.setp(ax.spines.values(), lw=0.2)
# or
plt.setp(ax.spines.values(), linewidth=0.2)

Another way is to simply use a loop. Each spine defines a set() method that can be used to set a whole host of properties such as linewidth, alpha etc.

for side in ['top', 'bottom', 'left', 'right']:
    ax.spines[side].set(lw=0.2)
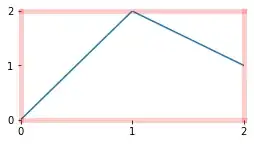
A working example:

import matplotlib.pyplot as plt

x, y = [0, 1, 2], [0, 2, 1]

fig, ax = plt.subplots(figsize=(4, 2))
ax.plot(y)
ax.set(xticks=x, yticks=x, ylim=(0,2), xlim=(0,2));

plt.setp(ax.spines.values(), lw=5, color='red', alpha=0.2);

result

cottontail
  • 10,268
  • 18
  • 50
  • 51