9

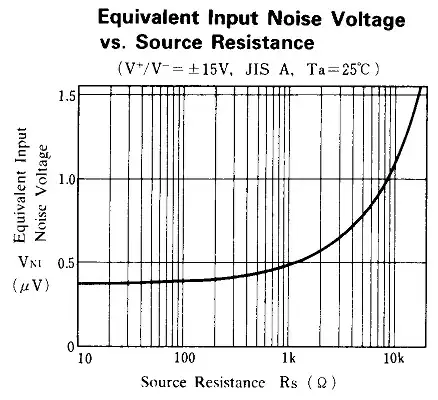
This isn't really "OCR", since it's not recognizing characters, but it's the same idea applied to curves. Anyone know of an image-processing library or established algorithm for retrieving the values from a (raster) plot image? For instance, in this graph, it's hard for me to read exact values with my eyes because there's such gaps between gridlines:

alt text

I can use a straight edge or whatever, but it's still going to be error-prone. It would be great if there were software that could just take a screenshot of any old graph and automatically convert it into a table of values or a function that could be queried.

Seems to be called "curve recognition"? Could also be used for extracting data from the curves in scientific papers for which the underlying data is not published.

And it's ok to have some human guidance. There's no reason an OCR couldn't read the "100" and match it up with the line, for instance, but it's ok to have a human give the lines numerical values after the machine has extracted the curve's path relative to the gridlines. I'm mostly interested in the function of tracing the curve relative to the grid, even if the grid is tilted, rotated, or warped in a non-affine way.

Update:

There is now a Wikipedia article called Converting scanned graphs to data with a bunch of software in the links. Also some software on alternativeto.net. I guess the theory belongs on http://dsp.stackexchange.com now, while the software solutions belong on http://superuser.com?
Glorfindel
  • 21,988
  • 13
  • 81
  • 109
endolith
  • 25,479
  • 34
  • 128
  • 192
  • 1
    I've used http://arohatgi.info/WebPlotDigitizer/ requires some manual annotation of the graph, but in your case I think it is the easiest option! – Rasmus Bååth Nov 13 '13 at 13:46
  • 1
    @RasmusBååth: Yep that's what I've been using. This is more of a programming question, though. – endolith Nov 13 '13 at 16:49
  • 1
    I use [PlotDigitizer](https://plotdigitizer.com/). You can try its [free online app here](https://plotdigitizer.com/app). – Anonymous Jan 15 '21 at 12:19

7 Answers7

6

This is extremely hard and error-prone. (We do this sort of thing a lot in chemistry where we try to analyze chemistry.) It depends critically on various parameters and conditions.

  1. Is the image a bit-map (pixels-only) or vectors (EMF, WMF, SVG, PS, PDF...)? Vectors are vastly better than pixels. We tackle vectors (including PDF) but don't touch pixels. Some of our collbaorators will try to use pixels but only on fairly recent documents.
  2. If you are stuck with pixels then are your images all from the same source? If so you have a small chance of extracting font information. I am afraid your image is so poor that it would require a great deal of work. However if you can work out the font you have a chance of extracting text and numbers if all docs are from the same source. You could use heuristics (rules such as where the numbers might be) or machine-learning (a list of features on whioch the methods can be trained).
  3. Your image appears to have been scanned (as the axes are pixelated). That makes it even worse. What appears a straight line to the eye is horrible for a machine. Is your image skewed on the page? You may have to deskew it.
  4. If you have a model for the lines and curves then you may have a change of modelling expected parameters into the image. But it's not trivial.

I'm sorry to be pessimistic. If you really want the info then it can be done with a lot of investment or collaboration with groups which do this sort of thing.

peter.murray.rust
  • 37,407
  • 44
  • 153
  • 217
  • I don't think it's as hard as you imagine it to be. What specific experience do you have with this? I don't understand what scraping graphs has to do with "analyzing chemistry". – endolith Nov 01 '09 at 22:11
  • And yes, I mean rasterized graphs, not vector images. – endolith Nov 01 '09 at 22:12
  • 1
    @endolith the graph above could well appear in a chemistry paper. We have analysed (and published in peer-reviwed journals) on how to extract information from scientific papers. These happen to be mainly in chemistry but they contain graphs that show all the aspects of this problem. You "don't think it's as hard as I imagine". If you have actually managed to write software than can extract information (without human help) from the picture shown then you will amaze a lot of people. – peter.murray.rust Nov 01 '09 at 22:16
  • @endolith even OCR on the characters in your graph (let alone the lines) will give rise to considerable errors. If you don't believe this, get an OCR program and try. – peter.murray.rust Nov 01 '09 at 22:20
  • *There's no reason an OCR couldn't read the "100" * The quality of these glyphs is so poor that you will almost certainly get thinks like "lOO" (el-oh-oh, not one-zero-zero). Indeed the pixels bleed from one glyph to another so I doubt you would even get this. Remember the OCR has not been trained on this graph. It is, of course, possible to create software that allows manual annotation on an overlay of the graph but I assumed you wanted something more automatic. – peter.murray.rust Nov 01 '09 at 22:46
  • 2
    The point of my question is to read the position of the curve in relation to the grid lines, not to read the text. I said so in the first sentence of the question. But I still stand by my statement that OCR has no trouble reading the number "100", especially since I just ran this image through ocrterminal.com, onlineocr.net, free-ocr.com, and googlecodesamples.com and they all read "100". And those are optimized for pages of text. If an OCR algorithm knows it's looking for numbers and not letters, and that they're aligned along a grid, it's going to be even more accurate. – endolith Nov 03 '09 at 01:57
  • 1
    "Your image appears to have been scanned ... That makes it even worse. What appears a straight line to the eye is horrible for a machine." I don't see why. Even an example Hough transform script can find the lines in the image: http://www.flickr.com/photos/56868697@N00/4071011102/ A dedicated program looking for evenly-spaced parallel lines of equal length should be able to do this very well. – endolith Nov 03 '09 at 03:41
3

google for "curve recognition software" suggests http://www.curveunscan.com/

anonymous
  • 163
  • 2
  • Hmmm... It says "curve recognition algorithm", but also talks about picking the points by hand: http://www.curveunscan.com/features.htm – endolith Nov 03 '09 at 01:27
  • It kind of works, but requires a lot of hand-picking of points, tracks curves poorly, and crashes often. :/ – endolith Nov 05 '09 at 00:35
  • Here's another software solution, with some curve following ability: http://digitizer.sourceforge.net/ – endolith Jul 24 '10 at 14:51
3

http://www.digitizeit.de/ is a program for digitizing graphs.

chris
  • 31
  • 1
2

There is also potrace which is related, and that page in turn mentions other alternatives

pixelbeat
  • 30,615
  • 9
  • 51
  • 60
1

I don't know of any software that does what you're asking, but if you can get just a few points you can use some kind of regression to find the best function that fits those points. This particular graph looks like an exponential function. So you'd want to find an exponential regression calculator.

David Brown
  • 13,336
  • 4
  • 38
  • 55
1

I use im2graph to convert graph images to data, that is, numbers. im2graph is free and available for Linux and Windows. Very smooth and requires very little effort on your part to generate results. See http://www.im2graph.co.il

im2graph
  • 51
  • 1
0

It is very difficult to scrape the values with naked eyes. But you can use graph digitizers that can allow you to sample off-grid points. There are many such tools on the internet. Someone has already mentioned Digitizeit. However, it is not free.

Here are my preferred tools that I often use to extract data points from graphs and scanned documents.

  1. PlotDigitizer.com: It is free (online) and paid (offline) and supports many graphs. It also supports the logarithmic scale, like the one in your graph.
  2. WebPlotDigitizer: It is also a very popular tool and completely free. But sometimes, I find is buggy and glitchy.
  3. Digitizeit: It a paid tool and has no online version.
Anonymous
  • 255
  • 1
  • 10