I am wanting to rotate a legend to be placed outside the graph on the right axis. I can place the legend outside the graph, but I cannot figure out how to rotate it. I tried using las=2, but that clearly didn't work. Note: I am using all other axes, or I would place the legend above the graph with two columns to achieve the same look.
A general example of what I have already:
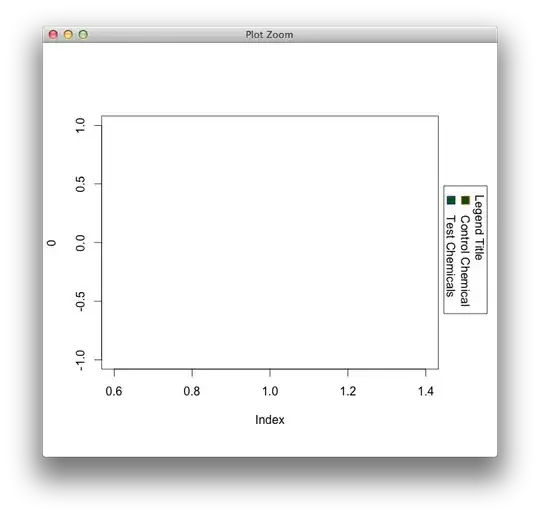
par(mar=c(6,4,5,4)+0.1)
plot(0,type="n")
legend(x="right",
       legend=c("Control Chemical","Test Chemcials"),
       bty="n",
       fill=c("Darkgreen","Dodgerblue4"),
       title="Legend Title",
       inset=c(-0.2,0),
       xpd=TRUE,
       horiz=TRUE)
The margins may need some adjustment, but I can easily make those once I figure out how to rotate the legend.
For additional clarification, what I am hoping to achieve is similar to:
legend(x="top",
       legend=c("Control Chemical","Test Chemcials"),
       bty="n",
       fill=c("Darkgreen","Dodgerblue4"),
       title="Legend Title",inset=c(0,-0.3),
       xpd=TRUE,
       horiz=TRUE)
But on the right axis rather than the top axis.