0

I'm new to R and have the following challenge;

I want to create a visualization that basically combines 2 kind of 'heatmaps' in order to visualize at what times there are truly dark skies (for astronomy). For this I want to have a heatmap that visualizes the brightness of the moon based on the moonrise and moonset times and the phase of the moon. On this then we can plot a 'band'like heatmap for the time the sun is up with some transparency. I'm not sure if this is going to work visualy or if I need to find some other solution, however this seems like a good challenge to get into R some more. But I could use some pointers as I'm stuck already loading the matrix of size 24(hours) x 31(days) with all the 720 values. When trying to create a basic data.frame from the vectors I get the error that the number of rows are inconsistent.

Furthermore I have some heatmap examples working already, but I'm not sure how to combine 2 of them in the same plot like I described.

As an illustration the current 'heatmap' as it is in excel
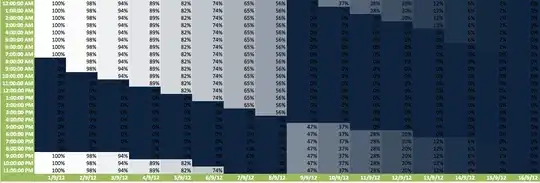
Current heatmap from excel

And some data:

MOON

moon <- structure(list(X1.9.12 = structure(c(2L, 2L, 2L, 2L, 2L, 2L, 
2L, 2L, 1L, 1L, 1L, 1L, 1L, 1L, 1L, 1L, 1L, 1L, 1L, 1L, 1L, 2L, 
2L, 2L), .Label = c("0%", "100%"), class = "factor"), X2.9.12 = structure(c(2L, 
2L, 2L, 2L, 2L, 2L, 2L, 2L, 2L, 2L, 1L, 1L, 1L, 1L, 1L, 1L, 1L, 
1L, 1L, 1L, 1L, 2L, 2L, 2L), .Label = c("0%", "98%"), class = "factor"), 
    X3.9.12 = structure(c(2L, 2L, 2L, 2L, 2L, 2L, 2L, 2L, 2L, 
    2L, 2L, 1L, 1L, 1L, 1L, 1L, 1L, 1L, 1L, 1L, 1L, 2L, 2L, 2L
    ), .Label = c("0%", "94%"), class = "factor"), X4.9.12 = structure(c(2L, 
    2L, 2L, 2L, 2L, 2L, 2L, 2L, 2L, 2L, 2L, 2L, 1L, 1L, 1L, 1L, 
    1L, 1L, 1L, 1L, 1L, 1L, 2L, 2L), .Label = c("0%", "89%"), class = "factor"), 
    X5.9.12 = structure(c(2L, 2L, 2L, 2L, 2L, 2L, 2L, 2L, 2L, 
    2L, 2L, 2L, 2L, 1L, 1L, 1L, 1L, 1L, 1L, 1L, 1L, 1L, 2L, 2L
    ), .Label = c("0%", "82%"), class = "factor"), X6.9.12 = structure(c(2L, 
    2L, 2L, 2L, 2L, 2L, 2L, 2L, 2L, 2L, 2L, 2L, 2L, 2L, 1L, 1L, 
    1L, 1L, 1L, 1L, 1L, 1L, 1L, 2L), .Label = c("0%", "74%"), class = "factor"), 
    X7.9.12 = structure(c(2L, 2L, 2L, 2L, 2L, 2L, 2L, 2L, 2L, 
    2L, 2L, 2L, 2L, 2L, 2L, 1L, 1L, 1L, 1L, 1L, 1L, 1L, 1L, 1L
    ), .Label = c("0%", "65%"), class = "factor"), X8.9.12 = structure(c(2L, 
    2L, 2L, 2L, 2L, 2L, 2L, 2L, 2L, 2L, 2L, 2L, 2L, 2L, 2L, 2L, 
    1L, 1L, 1L, 1L, 1L, 1L, 1L, 1L), .Label = c("0%", "56%"), class = "factor"), 
    X9.9.12 = structure(c(1L, 1L, 1L, 1L, 1L, 1L, 1L, 1L, 1L, 
    1L, 1L, 1L, 1L, 1L, 1L, 1L, 1L, 2L, 2L, 2L, 2L, 2L, 2L, 2L
    ), .Label = c("0%", "47%"), class = "factor"), X10.9.12 = structure(c(2L, 
    1L, 1L, 1L, 1L, 1L, 1L, 1L, 1L, 1L, 1L, 1L, 1L, 1L, 1L, 1L, 
    1L, 2L, 2L, 2L, 2L, 2L, 2L, 2L), .Label = c("0%", "37%"), class = "factor"), 
    X11.9.12 = structure(c(2L, 2L, 1L, 1L, 1L, 1L, 1L, 1L, 1L, 
    1L, 1L, 1L, 1L, 1L, 1L, 1L, 1L, 1L, 2L, 2L, 2L, 2L, 2L, 2L
    ), .Label = c("0%", "28%"), class = "factor"), X12.9.12 = structure(c(2L, 
    2L, 2L, 1L, 1L, 1L, 1L, 1L, 1L, 1L, 1L, 1L, 1L, 1L, 1L, 1L, 
    1L, 1L, 2L, 2L, 2L, 2L, 2L, 2L), .Label = c("0%", "20%"), class = "factor"), 
    X13.9.12 = structure(c(2L, 2L, 2L, 2L, 1L, 1L, 1L, 1L, 1L, 
    1L, 1L, 1L, 1L, 1L, 1L, 1L, 1L, 1L, 1L, 2L, 2L, 2L, 2L, 2L
    ), .Label = c("0%", "12%"), class = "factor"), X14.9.12 = structure(c(2L, 
    2L, 2L, 2L, 2L, 2L, 1L, 1L, 1L, 1L, 1L, 1L, 1L, 1L, 1L, 1L, 
    1L, 1L, 1L, 2L, 2L, 2L, 2L, 2L), .Label = c("0%", "6%"), class = "factor"), 
    X15.9.12 = structure(c(2L, 2L, 2L, 2L, 2L, 2L, 2L, 1L, 1L, 
    1L, 1L, 1L, 1L, 1L, 1L, 1L, 1L, 1L, 1L, 1L, 2L, 2L, 2L, 2L
    ), .Label = c("0%", "2%"), class = "factor"), X16.9.12 = structure(c(1L, 
    1L, 1L, 1L, 1L, 1L, 1L, 1L, 1L, 1L, 1L, 1L, 1L, 1L, 1L, 1L, 
    1L, 1L, 1L, 1L, 1L, 1L, 1L, 1L), .Label = "0%", class = "factor"), 
    X17.9.12 = structure(c(2L, 2L, 2L, 2L, 2L, 2L, 2L, 2L, 2L, 
    2L, 1L, 1L, 1L, 1L, 1L, 1L, 1L, 1L, 1L, 1L, 2L, 2L, 2L, 2L
    ), .Label = c("0%", "1%"), class = "factor")), .Names = c("X1.9.12", 
"X2.9.12", "X3.9.12", "X4.9.12", "X5.9.12", "X6.9.12", "X7.9.12", 
"X8.9.12", "X9.9.12", "X10.9.12", "X11.9.12", "X12.9.12", "X13.9.12", 
"X14.9.12", "X15.9.12", "X16.9.12", "X17.9.12"), class = "data.frame", row.names = c("0:00:00", 
"1:00:00", "2:00:00", "3:00:00", "4:00:00", "5:00:00", "6:00:00", 
"7:00:00", "8:00:00", "9:00:00", "10:00:00", "11:00:00", "12:00:00", 
"13:00:00", "14:00:00", "15:00:00", "16:00:00", "17:00:00", "18:00:00", 
"19:00:00", "20:00:00", "21:00:00", "22:00:00", "23:00:00"))

SUN

    September   
Day Sunrise Sunset
1   6:52    20:26
2   6:54    20:24
3   6:56    20:22
4   6:57    20:20
5   6:59    20:17
6   7:00    20:15
7   7:02    20:13
8   7:04    20:10
9   7:05    20:08
10  7:07    20:06
11  7:08    20:05
12  7:09    20:02
13  7:11    20:00
14  7:13    19:58
15  7:14    19:55
16  7:16    19:53
17  7:17    19:51
18  7:19    19:48
19  7:21    19:46
20  7:22    19:44
21  7:25    19:40
22  7:26    19:38
23  7:28    19:35
24  7:30    19:33
25  7:31    19:31
26  7:33    19:28
27  7:35    19:26
28  7:36    19:24
29  7:38    19:21
30  7:40    19:19

Beasterfield
  • 7,023
  • 2
  • 38
  • 47
Chrisvdberge
  • 1,824
  • 6
  • 24
  • 46
  • 2
    I would avoid trying to overlap two heatmaps, as that seems needlessly complicated. Instead, preprocess your data so that you start with a matrix of visible moon times. Then, change the values of this matrix when the sun is out (i.e., leaving all other matrix entries the same, change the values of cells during daytime to 0). Then you can just draw one heatmap with the same resulting output. – Thomas Jun 11 '13 at 12:21
  • That was indeed my 2nd scenario I'd like to explore ;) That will require some more 'personal interpretation' though. However, I'm still somewhat in the dark as to how to create the data.frame with data as shown in the picture. Any suggestion as to how to do that? – Chrisvdberge Jun 11 '13 at 12:25
  • One thing I would try is to split each cell diagonally; one triangle filled according to the moon, the other according to the sun. Another option might be to have the moon as a filled circle inside the cell, with gradual change in colour. – baptiste Jun 11 '13 at 12:44
  • added some data to the original post. – Chrisvdberge Jun 11 '13 at 12:51
  • @baptiste thx for the suggestions, however I don't think this will make the most important message stand out from this visual; when is it really dark? (that's basically all i'm interested in ;) ) – Chrisvdberge Jun 11 '13 at 12:52
  • If the data is already in R, can you give us a `dput()` so it's easier to work with? – Thomas Jun 11 '13 at 12:53
  • @Chrisvdberge the cell would be fully dark when both parts are dark. Why do you need to have the two bits of informations on top one another? – baptiste Jun 11 '13 at 12:57
  • @Thomas, it isn't. That was what Im trying to ask first; how do I get this data in a dataframe without R complaining that the number of rows dont match :P – Chrisvdberge Jun 11 '13 at 13:03
  • @baptiste that is correct, but it will also result in a lot of half dark/half light cells as the moon can be at 0% during the day time as well. Combining the two datasets might be easiest, but would like to explore the other possibility as well :) – Chrisvdberge Jun 11 '13 at 13:03
  • Try `read.table` with the argument `fill=TRUE` , which will insert blank fields where row lengths are unequal. If you can provide a small sample of what's in your Excel file, we can help you figure out why the row lengths are not what's expected. – Carl Witthoft Jun 11 '13 at 13:41
  • @thomas thx for converting the data into R format. However, if I want to scale now I get the message that 'x' must be numeric .. Is the data set formatted wrong and/or do I need to process it first in some way? In the end I'm looking at this format btw to plot all the months in a donut (12 months like hours on the clock) http://stackoverflow.com/questions/13887365/ggplot2-circular-heatmap-that-looks-like-a-donut – Chrisvdberge Jun 11 '13 at 14:04
  • Sounds like the usual problem that a column got read in as a factor. convert the column with `as.numeric(as.character(thedata))` – Carl Witthoft Jun 11 '13 at 15:35
  • They're percentages so it's actually probably easier to `gsub` the "%" symbols out of the values then convert to numeric. – Thomas Jun 11 '13 at 16:47

1 Answers1

4

So from what I understood, there are basically two questions:

Data organization

The easiest would be, if you'd have all data in one data.frame in long format. I.e. for each combination of time and date you have one row, with additional columns for the moon and sun intensity.

So we start with melting and fixing the moon data:

library(reshape2)
moon$time <- row.names(moon)
moon <- melt(moon, id.vars="time", variable.name="date", value.name="moon" )
moon$date <- sub("X(.*)", "\\1", moon$date)
moon$moon <- 1 - as.numeric(sub("%", "", moon$moon)) /100

Now we bring the sun data to an comparable form, by at least give them the same identifier for the date:

sun$Day <- paste( sun$Day, "9.12", sep  ="." )

Next step is to merge the data by the date resp. Day and to set a comparable column for the sun intensity as is given already for the moon intensity. This can be done by casting the times to a time format and compare Sunrise and Sunset with the actual time:

mdf <- merge( moon, sun, by.x = "date", by.y = "Day" )
mdf$time.tmp <- strptime(mdf$time, format="%H:%M")
mdf$Sunrise  <- round(strptime(mdf$Sunrise, format="%H:%M"), units = "hours")
mdf$Sunset   <- round(strptime(mdf$Sunset, format="%H:%M"), units = "hours")
mdf$sun <- ifelse( mdf$Sunrise <= mdf$time.tmp & mdf$Sunset >= mdf$time.tmp, 1, 0 )
mdf <- mdf[c("date", "time", "moon", "sun")]

mdf[ 5:10, ]
  date    time moon sun
1.9.12 4:00:00    0   0
1.9.12 5:00:00    0   0
1.9.12 6:00:00    0   0
1.9.12 7:00:00    0   1
1.9.12 8:00:00    1   1
1.9.12 9:00:00    1   1

Plotting

Adding multiple layers with different transparencies begs literally for ggplot2. In order to use this in a proper way, there is one more data manipulation necessary, which ensures the proper order on the axes: date and time have to be converted to factors with factor levels ordered not lexically, but by time:

mdf <- within( mdf, {
  date <- factor( date, levels=unique(date)[ order(as.Date( unique(date), "%d.%m.%y" ) ) ] )
  time <- factor( time,  levels=unique(time)[ order(strptime( time, format="%H:%M:%S"), decreasing=TRUE ) ] )
} )

This can be plot now:

library( ggplot2 )
ggplot( data = mdf, aes(x = date, y = time )  ) + 
  geom_tile( aes( alpha = sun  ), fill = "goldenrod1"  ) +
  geom_tile( aes( alpha = moon ), fill = "dodgerblue3" ) +
  scale_alpha_continuous( "moon", range=c(0,0.5) ) +
  theme_bw() +
  theme(axis.text.x = element_text(angle = 45, hjust = 1))

Which gives you the following result

enter image description here

Beasterfield
  • 7,023
  • 2
  • 38
  • 47
  • That looks indeed like what I was going for, thx a lot! I will get hands on with your advice and tips myself tomorrow. :) Could I just extend this with the method here to create a donut with all 12 months you think? http://stackoverflow.com/questions/13887365/ggplot2-circular-heatmap-that-looks-like-a-donut – Chrisvdberge Jun 11 '13 at 20:35
  • I'm afraid I lost you there for a bit on the Sun data part. How did you load it in the object sun exactly? I'm not sure I'm doing it right as I think something is going wrong with the time format if I just load those values in a vector and combine those into the dateframe sun – Chrisvdberge Jun 11 '13 at 20:54
  • @Chrisvdberge wow, the donut looks very impressing! The trick is to perform a coordinate transformation using `+ coord_polar(theta="x")`. Concerning the sun data, I am not sure which part you mean exactly. So the first is to `merge` the moon and sun data. By doing this, the sun data is *automatically* expanded to the moon data. You should have a look on the data.frames `sun`, `moon` and `mdf` after doing the `merge`. Looking at `? merge`should help as well. – Beasterfield Jun 11 '13 at 22:22
  • N00b alert here; you say the first step is to merge moon and sun data, but I have trouble getting the sun data into R in a good way. :| I tried just loading the 2 columns each in a vector, but if I display that factor I get a lot more/different values, so I guess something is wrong with the format and/or the colon – Chrisvdberge Jun 12 '13 at 09:05
  • 1
    @Chrisvdberge hard to say without any code. I thought you have the sun data already in your workspace. I read it with `read.table( text ="", header = TRUE)` and then copied exactly the data you posted here (without the first line which says "september") and pasted them between the quotation marks in `text = ""`. If you still have problems to read in the sun data, you either have to edit your question or ask another one, but most probably the same has been asked already a couple of times. – Beasterfield Jun 12 '13 at 09:30
  • When im reading it in with read.table I get the data in object sun, but I get the following error when trying your code; > mdf$Sunrise <- round(strptime(mdf$Sunrise, format="%H:%M"), units = "hours") Error in round.POSIXt(list(sec = c(0, 0, 0, 0, 0, 0, 0, 0, 0, 0, 0, 0, : unused argument (units = "hours") Any idea why this is? – Chrisvdberge Jun 12 '13 at 12:32
  • @Chrisvdberge do you inspect the objects you create step by step? So for example if `sun$Sunrise` or `strptime(mdf$Sunrise, format="%H:%M")` contains nonsense, `round` will you give also nonsense (this is called the SISO principle: Shit-In-Shit-Out). I doubt that this could be a reason, but Which R-version are you using? Does `? round.POSIXt` know a parameter `units`? Again: How you get the sun data read appropriatly in a `data.frame` is a different question. Either you edit your original question and show more code (including, `head`, `dput`, etc.) or you open a new question. – Beasterfield Jun 12 '13 at 12:50
  • it does know the parameter units yes. And mdf$Sunrise contains the times correctly so it seems. Also the strptime(mdf$Sunrise, format="%H:%M") is working correctly. However the error occurs as soon as I try to round it. On a side note, I noticed you cited the line of code "sun$Day <- paste( sun$Day, "9.12", sep ="." )" twice in your instruction. Could it be that I'm missing one step from your instruction because of this? – Chrisvdberge Jun 12 '13 at 13:02
  • @Chrisvdberge thanks for the hint, I pasted the line one time too often. Concerning the other thing I'm afraid nobody is able to help you with that bite of information. Which R-version are you using? What is the output of your `sessionInfo()`? How does your exact code looks like? Please open a new question for this issue and then come back to this question. These are comments not a chat and not the right place to cover so many open questions which havent been asked in the original post. – Beasterfield Jun 12 '13 at 13:29
  • A fresh session solved the problem Thx for the help and apologies for the amount of comments ;) Will start and try to work your solution into a donut for all the months. – Chrisvdberge Jun 12 '13 at 15:03
  • 1
    @Chrisvdberge glad to hear that! If you want to go for the one year donut, I'd encourage you 1) to have a look at the `lubridate`package which makes working with time objects much easier and 2) to use `geom_raster` instead of `geom_tile` as this handles large data sets much more efficient. – Beasterfield Jun 12 '13 at 15:41