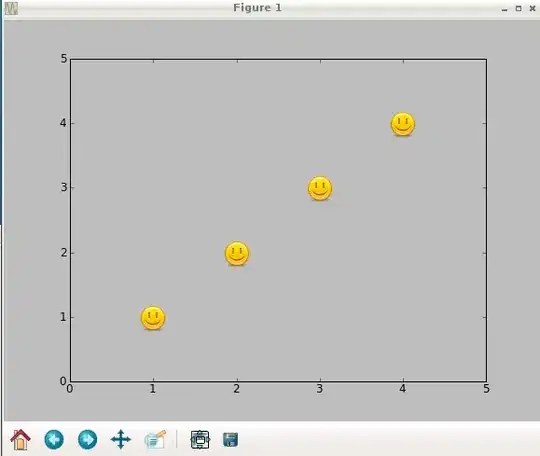
I want to use R to produce a graph that looks like this:
https://dl.dropboxusercontent.com/u/9297902/R_desired_output.png
The scale runs from 0 on the left to 100 on the right, with each major category (poor, fair, etc.) taking up 25%. I think I need to: 1. make multiple background boxes for colors (#D55E00, #E69F00, #56B4E9, #009E73) 2. change gridline color, positions (from at my y category values to between them), and thickness 3. select an appropriate symbol (that allows me to have outline & fill with bar?) 4. place for labels on top of graph (Poor, Fair, Good, Excellent) in a more controlled, predictable manner
Here is where I am so far:
# assemble data
metric<-c("Bottom Substrate","Deposition",
   "Substrate Stability","In-stream Cover",
   "Pool Substrate","Pool Quality",
   "Pool Variability","Channel Alteration",
   "Channel Sinuosity","Width/Depth",
   "Hydrolic Diversity","Canopy Cover",
   "Bank Vegetation","Immediate Land Use",
   "Flow Related Refugia")
score<-c(10.53,18.18,13.33,9.09,
   26.32,6.67,6.67,57.14,
   18.18,40.00,27.27,
   9.09,73.33,71.43,27.27)

hab<-data.frame(metric,score) #create data frame

library(ggplot2)

# colorblind friendly colors
# #000000 # Black
# #E69F00 # Orange
# #56B4E9 # Sky Blue
# #009E73 # bluish Green
# #F0E442 # Yellow
# #0072B2 # Blue
# #D55E00 # Vermillion
# #CC79A7 # reddish Purple

# set up to remove x axis values, and axis titles
theme_mod <- theme(axis.text.x = element_blank(),
   axis.title.x = element_blank(),
   axis.title.y = element_blank())

qplot(score,metric) +
   geom_point(aes(score,metric), size=6, pch="|") + # pch gets the symbol I want, how to lose the dot?
   scale_x_continuous(limits=c(0,100)) + # locks scale to be 0-100, whcih I want
   opts(title="Poor                    Fair                       Good                        Excellent") +
   theme_mod # removes axis stuff
So, I'm kind of far from ready to go. It seems to have reordered my dataset for some reason, too.
I've looked here for possibilities, but I'm not sure which way to go:
Using ggplot2 in R, how do I make the background of a graph different colours in different regions?
Sorry I'm a bit of a novice - thanks in advance for any pointers.