9

I have a question regarding tableGrob/grid.table from the gridExtra package. Using the regular parameter settings, it is straightforward to colour alternate rows. However, I was hoping that it might be feasible to get a bit more control over the colouring of the rows.

For example, is it possible to colour every third row in a different colour? I suspect the grid.edit function is one way to approach this, judging by the example in this link: http://code.google.com/p/gridextra/wiki/tableGrob but I can't figure out how to apply that to my question.

I believe the person who posted this question had the same in mind. Table with rows of different colors with tableGrob

I am currently stuck with R 2.13 due to compatibility issues, so if there are any suggestions which don't involve later versions that would be ideal.

Example code:

library(gridExtra)

grid.table(mtcars[1:10, ],
           gpar.coretext = gpar(fontsize = 10),
           gpar.corefill = gpar(fill = "lightblue", alpha=0.5, col = NA),
           h.even.alpha = 0.5
           )

example table

Community
  • 1
  • 1
SauceCode
  • 287
  • 1
  • 3
  • 9
  • 2
    Welcome to Stack Overflow and well done for referencing other questions in your own to show that you've done some work on your own. May I suggest that in future questions you include a [reproducible example](http://stackoverflow.com/questions/5963269/how-to-make-a-great-r-reproducible-example), either using your own data, 'fake' data or a built-in such as the `mtcars` data set. Simple, indeed minimal, is best (I have added one to yours), just enough to allow others to copy, paste and experiment. – SlowLearner Aug 24 '13 at 07:24

1 Answers1

10

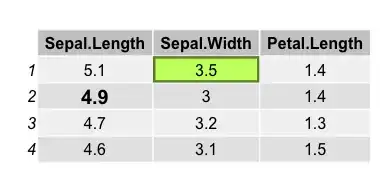
starting with v>=2.0.0 of gridExtra, grid.table is now based on gtable, and can be customised to deeper levels than in previous versions. The vignette has more examples, but for completeness here is an example illustrating how to highlight specific cells,

g <- tableGrob(iris[1:4, 1:3])
find_cell <- function(table, row, col, name="core-fg"){
  l <- table$layout
  which(l$t==row & l$l==col & l$name==name)
}

ind <- find_cell(g, 3, 2, "core-fg")
ind2 <- find_cell(g, 2, 3, "core-bg")
g$grobs[ind][[1]][["gp"]] <- gpar(fontsize=15, fontface="bold")
g$grobs[ind2][[1]][["gp"]] <- gpar(fill="darkolivegreen1", col = "darkolivegreen4", lwd=5)
grid.draw(g)

Edit: the above function is easily "vectorised"

find_cells <- function(table, row, col, name="core-fg"){
  l <- table$layout
  unlist(Map(function(r, c) which(((l$t-1) == r) & ((l$l-1) == c) & (l$name == name)), row, col))
}

modify_cells <- function(g, ids, gp=gpar()){
  for(id in ids) g$grobs[id][[1]][["gp"]] <- gp
  return(g)
}

ids <- find_cells(g, 1:3, c(3,2, 1), "core-fg")
g <- modify_cells(g, ids, gpar(fontsize=15, fontface="bold"))

grid.newpage()
grid.draw(g)

enter image description here

Note that in most cases it would make more sense to specify the parameters during the table construction,

faces <- sample(1:4, size = prod(dim(iris[1:4, 1:2])), replace = TRUE)
tt <- ttheme_default(core=list(fg_params=list(fontface=faces)))

grid.table(iris[1:4, 1:2], theme=tt)

enter image description here

baptiste
  • 75,767
  • 19
  • 198
  • 294
  • I don't know if somebody is still listening here, but I'll try anyway: is it possible to tweak the find_cell function such that it finds several different cells at once and not just one by one? For instance, all Sepal.Length >4.8 get written in bold. I have a tableGrob with statistical significance testing and I need all pvalues < 0.05 to be bold. It would be good to have this in one function rather than manually doing it for each cell. thanks – PaoloCrosetto Jan 13 '17 at 08:45
  • What does the name ""core-fg" mean/do? – user2946746 May 18 '17 at 19:12
  • the table is divided into 3 parts: column header, row header, and core cells (body). Each of those has two "layers": a background rectangle (grey here for the core, darker for the column header), and a foreground ("fg") for the text. – baptiste May 18 '17 at 19:23