I saw that this related question was asked in 2010 (titled: How do you set different scale limits for different facets?) and would like to know if it is yet possible to have different breaks for different facets?
The reason being is that I want only integer values in the lower chart (with breaks of 50 for the top chart) of following plot:
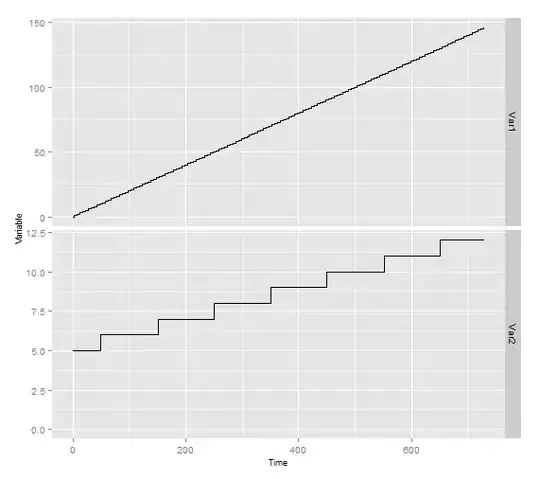
Code to reproduce the image:
dat <- data.frame(date=seq(0, 729, 1), Var1=round(seq(from=0, length.out=730, by=0.2)),   Var2=round(seq(from=5, length.out=730, by=0.01))  )
dat.m <- melt(dat, id.var="date")
ggplot(dat.m, aes(date,  value)) +
      scale_x_continuous(name="Time") +
      expand_limits(y=0) +
      ylab("Variable") +
      geom_step() +
      facet_grid(variable~., scales="free_y")+
      scale_y_continuous(breaks = seq(0, 150, by = 1))