227

I'm doing some assembly-level debugging in GDB. Is there a way to get GDB to show me the current assembly instruction in the same way that it shows the current source line? The default output after every command looks like this:

0x0001433f      990         Foo::bar(p);

This gives me the address of the current instruction, but I have to keep referring back to the output of disassemble in order to see which instruction I'm currently executing.
Peter Mortensen
  • 30,738
  • 21
  • 105
  • 131
JSBձոգչ
  • 40,684
  • 18
  • 101
  • 169

8 Answers8

385

You can switch to assembly layout in GDB:

(gdb) layout asm

See here for more information. The current assembly instruction will be shown in assembler window.

   ┌───────────────────────────────────────────────────────────────────────────┐
   │0x7ffff740d756 <__libc_start_main+214>  mov    0x39670b(%rip),%rax        #│
   │0x7ffff740d75d <__libc_start_main+221>  mov    0x8(%rsp),%rsi              │
   │0x7ffff740d762 <__libc_start_main+226>  mov    0x14(%rsp),%edi             │
   │0x7ffff740d766 <__libc_start_main+230>  mov    (%rax),%rdx                 │
   │0x7ffff740d769 <__libc_start_main+233>  callq  *0x18(%rsp)                 │
  >│0x7ffff740d76d <__libc_start_main+237>  mov    %eax,%edi                   │
   │0x7ffff740d76f <__libc_start_main+239>  callq  0x7ffff7427970 <exit>       │
   │0x7ffff740d774 <__libc_start_main+244>  xor    %edx,%edx                   │
   │0x7ffff740d776 <__libc_start_main+246>  jmpq   0x7ffff740d6b9 <__libc_start│
   │0x7ffff740d77b <__libc_start_main+251>  mov    0x39ca2e(%rip),%rax        #│
   │0x7ffff740d782 <__libc_start_main+258>  ror    $0x11,%rax                  │
   │0x7ffff740d786 <__libc_start_main+262>  xor    %fs:0x30,%rax               │
   │0x7ffff740d78f <__libc_start_main+271>  callq  *%rax                       │
   └───────────────────────────────────────────────────────────────────────────┘
multi-thre process 3718 In: __libc_start_main     Line: ??   PC: 0x7ffff740d76d
#3  0x00007ffff7466eb5 in _IO_do_write () from /lib/x86_64-linux-gnu/libc.so.6
#4  0x00007ffff74671ff in _IO_file_overflow ()
   from /lib/x86_64-linux-gnu/libc.so.6
#5  0x0000000000408756 in ?? ()
#6  0x0000000000403980 in ?? ()
#7  0x00007ffff740d76d in __libc_start_main ()
   from /lib/x86_64-linux-gnu/libc.so.6
(gdb)
Peter Mortensen
  • 30,738
  • 21
  • 105
  • 131
ks1322
  • 33,961
  • 14
  • 109
  • 164
  • 1
    @greatwolf, looks like you have no tui support in your gdb. See this question for more information: http://stackoverflow.com/q/6706838/72178. – ks1322 Jul 02 '13 at 09:33
  • 13
    Neat! Now can I have a similar window for the registers? Indeed I can: `layout regs` – Jens Mar 10 '14 at 03:53
  • 1
    See also [gdb docs for other TUI commands](https://sourceware.org/gdb/onlinedocs/gdb/TUI-Commands.html), like `tui reg vector` to show the vector regs instead of the integer regs. (Not always very usable, though, because it doesn't let you pick just the `.v8_int16` or something, so the display is a big mess.) See the [x86 tag wiki](http://stackoverflow.com/tags/x86/info) for a quick tutorial to debugging asm. – Peter Cordes Apr 23 '16 at 19:16
  • 1
    That's about a useless feature and output. The C++ mangled names are too long, and everything I'm trying to view is off the screen on the right. What a stupid decision (not to display ASM by default when `si`), and what a useless feature (viewport that does not display the necessary information). There's no sense in down voting this answer since you're only the messenger... – jww May 10 '17 at 05:30
  • @jww, you will probably like another answer to this question, though I have not tested it: http://stackoverflow.com/a/29953542/72178. – ks1322 May 10 '17 at 11:23
  • 3
    similarly, ```·layout src``` to see source code when debugging, and also worthing remembering exit this mode by ```CTRL+x+a``` – Baiyan Huang May 26 '19 at 10:16
  • @BaiyanHuang Thank you! I couldn't figure out how to quit indeed. `gdb` is the new `vim`, apparently. – brainplot Sep 19 '19 at 01:31
184

You can do

display/i $pc

and every time GDB stops, it will display the disassembly of the next instruction.

GDB-7.0 also supports set disassemble-next-line on, which will disassemble the entire next line, and give you more of the disassembly context.

Employed Russian
  • 199,314
  • 34
  • 295
  • 362
  • 2
    How do we enable this feature when using `si` (but not `s`)? – jww May 10 '17 at 05:32
  • 1
    You can also use `display/ni $pc` here to display `n` instructions, like in the comment to https://stackoverflow.com/a/1902906/129550 – fuzzyTew Oct 22 '20 at 21:46
74

The command

x/i $pc

can be set to run all the time using the usual configuration mechanism.

bmargulies
  • 97,814
  • 39
  • 186
  • 310
62

Setting the following option:

set  disassemble-next-line on
show disassemble-next-line

Will give you results that look like this:

(gdb) stepi
0x000002ce in ResetISR () at startup_gcc.c:245
245 {
   0x000002cc <ResetISR+0>: 80 b5   push    {r7, lr}
=> 0x000002ce <ResetISR+2>: 82 b0   sub sp, #8
   0x000002d0 <ResetISR+4>: 00 af   add r7, sp, #0
(gdb) stepi
0x000002d0  245 {
   0x000002cc <ResetISR+0>: 80 b5   push    {r7, lr}
   0x000002ce <ResetISR+2>: 82 b0   sub sp, #8
=> 0x000002d0 <ResetISR+4>: 00 af   add r7, sp, #0
Jakuje
  • 24,773
  • 12
  • 69
  • 75
Bob Ensink
  • 721
  • 5
  • 3
43

If you want the next few instructions to display automatically while stepping through the program you can use the display command as follows -

display /3i $pc

The above will display 3 instructions whenever a breakpoint is hit or when you single step the program.

More details at the blog entry here.

mohit
  • 686
  • 5
  • 5
27

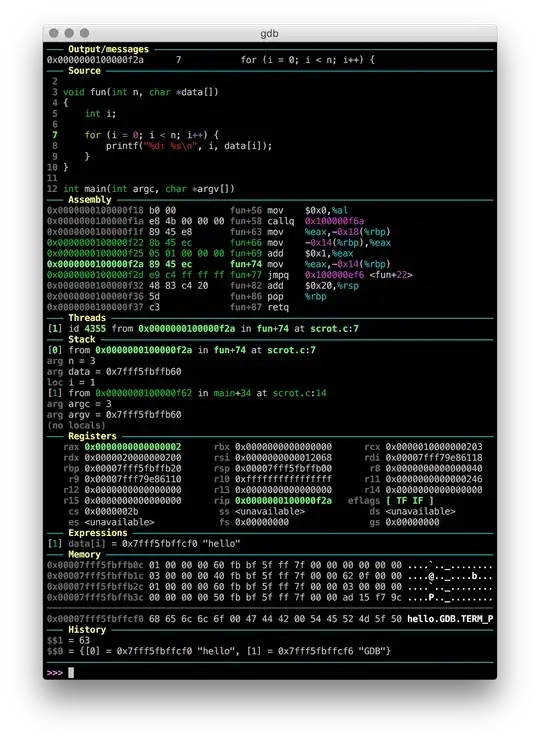
GDB Dashboard

https://github.com/cyrus-and/gdb-dashboard

This GDB configuration uses the official GDB Python API to show us whatever we want whenever GDB stops after for example next, much like TUI.

However I have found that this implementation is a more robust and configurable alternative to the built-in GDB TUI mode as explained at: gdb split view with code

For example, we can configure GDB Dashboard to show disassembly, source, registers and stack with:

dashboard -layout source assembly registers stack

Here is what it looks like if you enable all available views instead:

enter image description here

Related questions:

Ciro Santilli OurBigBook.com
  • 347,512
  • 102
  • 1,199
  • 985
  • 2
    @downvoters: please explain so I can learn and improve info. I believe that this is a superior alternative for the TUI currently accepted answer: https://stackoverflow.com/a/2015523/895245 – Ciro Santilli OurBigBook.com May 01 '19 at 14:36
  • Santilli This is a very useful tool. But when I use it, I can only look at the code near the current code location. Sometimes the code is executed to the nth line, but I want to see what the code is in other locations (such as a certain function)? Is there any way to make the position of the displayed code slide (if the assembly code can slide, it would be better)? – Gerrie Nov 23 '20 at 15:03
  • @cyj hi, do you want to show the disassembly of a specific function after every step? Or just after entering a given command manually from time to time? – Ciro Santilli OurBigBook.com Nov 23 '20 at 15:05
  • It does not need to be displayed all the time. Just sometimes I want to see what the code is in other locations. So I can roughly know what the result is when debugging. I wonder if I can scroll the position of the displayed code, because when debugging, only a few lines of code near the code being executed are displayed, which makes me unable to understand it based on the context. – Gerrie Nov 23 '20 at 15:12
  • 1
    @cyj if it is the current file, I often use the `edit` command to open the code in vim: https://vi.stackexchange.com/questions/2046/how-can-i-integrate-gdb-with-vim/13596#13596 If it is in another file, I tend to just use Eclipse and jump to the definition of a nearby function with Ctrl + Shift + T :-) Not perfect, but good enough. – Ciro Santilli OurBigBook.com Nov 23 '20 at 15:15
  • Thank you, I will try – Gerrie Nov 23 '20 at 15:19
  • I tried it and it worked. thank you. Do you know there are similar tools for python debugging? Can open a tui-like interface and display the code dynamically? – Gerrie Nov 25 '20 at 06:36
  • @cyj yes, with pdb, or slightly better, ipdb: https://stackoverflow.com/a/53172990/895245 It is generally crappier than GDB though, but does the job. – Ciro Santilli OurBigBook.com Nov 25 '20 at 08:18
25

From within gdb press Ctrl x 2 and the screen will split into 3 parts.

First part will show you the normal code in high level language.

Second will show you the assembly equivalent and corresponding instruction Pointer.

Third will present you the normal gdb prompt to enter commands.

See the screen shot

abhi
  • 3,476
  • 5
  • 41
  • 58
1

There is a simple solution that consists in using stepi, which in turns moves forward by 1 asm instruction and shows the surrounding asm code.

Tom
  • 834
  • 1
  • 14
  • 24