Here is a question for R-users. I am interested in drawing a histogram with points stacked up, instead of a bar. For example if the data is (1,1,2,1,2,3,3,3,4,4), then I would like to see three points stacked up at 1, 2 points stacked up at 2 and so on. What is the best way to do this in R?
Asked
Active
Viewed 1.0k times
4 Answers
6
You can do this yourself pretty quickly:
x <- c(1,1,2,1,2,3,3,3,4,4)
plot(sort(x), sequence(table(x)))
Jonathan Chang
- 24,567
- 5
- 34
- 33
-
Thanks Jonathan. This does the job for me! – Ramnath Dec 20 '09 at 13:41
6
The simplest answer I know is this:
x <- c(1,1,2,1,2,3,3,3,4,4)
stripchart(x,method="stack",at=0)
It's better than Jonathan Chang's suggestion because stripchart does proper stacking of points.
Rob Hyndman
- 30,301
- 7
- 73
- 85
-
Thanks Rob. Stripchart seems very intuitive, although I would prefer the stack of points to be separate. – Ramnath Dec 20 '09 at 13:42
5
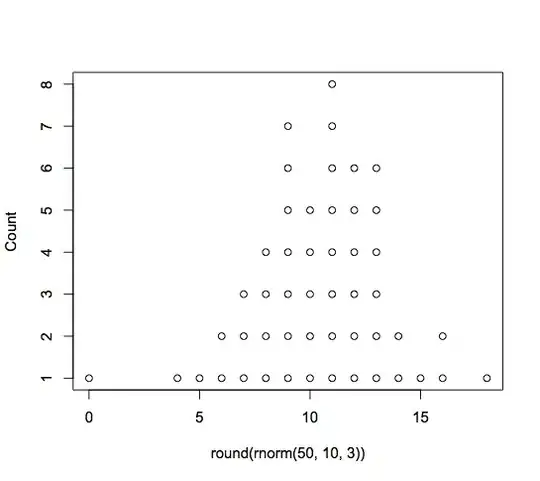
Greg Snow's TeachingDemos package contains a dots(x, ...) function which seems to fit your need:
dots( round( rnorm(50, 10,3) ) )
joran
- 169,992
- 32
- 429
- 468
Solomon Choe
- 66
- 3
-
-
@Ramnath: When you look at the source code it basically does the same as Jonathan Chang's answer – vonjd Apr 28 '16 at 10:10
2
Another easy way would be:
x <- c(1,1,2,1,2,3,3,3,4,4)
myhist <- hist(x)
myhistX <- myhist$mids
myhistY <- myhist$density
And now you can plot it in any way you like:
plot(myhistY~myhistX)
This way you can change the stacking options when building a "histogram" object.
Andrey Dyachenko
- 551
- 5
- 8