0

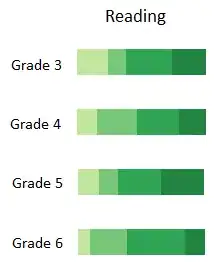
I'm trying to make a timeline with gnuplot, where a different color stands for a different objectdetection. Ultimately, it should look a bit like this (but only one line);

stacked

I thought of doing this with gnuplot, making a stacked barchart of it. My data file has 3 values: startframe, endframe and the difference between the two.

What I want to do is display the detections in the correct order, and how long they last (difference) I've already looked at the stacked histogram demo of gnuplot, but don't understand how to plot the correct values. Can anybody help me?

Thx!

Community
  • 1
  • 1
Tcanarchy
  • 760
  • 1
  • 8
  • 20
  • What does this question have to do with Qt if you want to use gnuplot? Fwiw, the OP got an answer here a few days ago: http://stackoverflow.com/questions/20801622/qt-making-a-stacked-barchart-with-different-colors/20802073#20802073 Some can port that code to gnuplot if that is easier. :) – László Papp Dec 29 '13 at 10:31
  • Similarly this appears to have nothing to do with C++, so I removed that tag as well. – Chris Hayes Dec 29 '13 at 11:04
  • I'm sorry, i'm trying to make a c++ gui application, and I need a timeline for that, whether it's in qt or gnuplot doesn't matter. The tags were still there because of my previous question. – Tcanarchy Dec 29 '13 at 11:18

0 Answers0