I'd like to draw a pie chart in my android application. Would you please suggest me a way to do that in a simple way ? I have written a view class for that purpose but it's not satisfying. So I would appreciate if you tell me a good and high performance chart library.
Asked
Active
Viewed 6.7k times
7 Answers
23
Download the jar from
http://www.achartengine.org/content/download.html
Add the jar to the projects lib folder. There is a sample also provided by the developers. You can check that and modify the same as you wish.
There is also a demo @
http://www.achartengine.org/content/demo.html
The docs
http://www.achartengine.org/content/javadoc/org/achartengine/chart/PieChart.html
Example:
<LinearLayout xmlns:android="http://schemas.android.com/apk/res/android"
    android:layout_width="fill_parent"
    android:layout_height="fill_parent"
    android:orientation="vertical" >

    <LinearLayout
        android:id="@+id/chart"
        android:layout_width="fill_parent"
        android:layout_height="wrap_content"
        android:layout_weight="1"
        android:orientation="horizontal" >
    </LinearLayout>

</LinearLayout>
The Activity class
public class AChartEnginePieChartActivity extends Activity {

    private static int[] COLORS = new int[] { Color.GREEN, Color.BLUE,Color.MAGENTA, Color.CYAN };

    private static double[] VALUES = new double[] { 10, 11, 12, 13 };

    private static String[] NAME_LIST = new String[] { "A", "B", "C", "D" };

    private CategorySeries mSeries = new CategorySeries("");

    private DefaultRenderer mRenderer = new DefaultRenderer();

    private GraphicalView mChartView;

    @Override
    protected void onCreate(Bundle savedInstanceState) {
        super.onCreate(savedInstanceState);
        setContentView(R.layout.main);

        mRenderer.setApplyBackgroundColor(true);
        mRenderer.setBackgroundColor(Color.argb(100, 50, 50, 50));
        mRenderer.setChartTitleTextSize(20);
        mRenderer.setLabelsTextSize(15);
        mRenderer.setLegendTextSize(15);
        mRenderer.setMargins(new int[] { 20, 30, 15, 0 });
        mRenderer.setZoomButtonsVisible(true);
        mRenderer.setStartAngle(90);

        for (int i = 0; i < VALUES.length; i++) {
            mSeries.add(NAME_LIST[i] + " " + VALUES[i], VALUES[i]);
            SimpleSeriesRenderer renderer = new SimpleSeriesRenderer();
            renderer.setColor(COLORS[(mSeries.getItemCount() - 1) % COLORS.length]);
            mRenderer.addSeriesRenderer(renderer);
        }

        if (mChartView != null) {
            mChartView.repaint();
        }

    }

    @Override
    protected void onResume() {
        super.onResume();
        if (mChartView == null) {
            LinearLayout layout = (LinearLayout) findViewById(R.id.chart);
            mChartView = ChartFactory.getPieChartView(this, mSeries, mRenderer);
            mRenderer.setClickEnabled(true);
            mRenderer.setSelectableBuffer(10);

            mChartView.setOnClickListener(new View.OnClickListener() {
                @Override
                public void onClick(View v) {
                    SeriesSelection seriesSelection = mChartView.getCurrentSeriesAndPoint();

                    if (seriesSelection == null) {
                        Toast.makeText(AChartEnginePieChartActivity.this,"No chart element was clicked",Toast.LENGTH_SHORT).show();
                    }
                    else {
                        Toast.makeText(AChartEnginePieChartActivity.this,"Chart element data point index "+ (seriesSelection.getPointIndex()+1) + " was clicked" + " point value="+ seriesSelection.getValue(), Toast.LENGTH_SHORT).show();
                    }
                }
            });

            mChartView.setOnLongClickListener(new View.OnLongClickListener() {
                @Override
                public boolean onLongClick(View v) {
                    SeriesSelection seriesSelection = mChartView.getCurrentSeriesAndPoint();
                    if (seriesSelection == null) {
                        Toast.makeText(AChartEnginePieChartActivity.this,"No chart element was long pressed", Toast.LENGTH_SHORT);
                        return false;
                    }
                    else {
                        Toast.makeText(AChartEnginePieChartActivity.this,"Chart element data point index "+ seriesSelection.getPointIndex()+ " was long pressed",Toast.LENGTH_SHORT);
                        return true;
                    }
                }
            });
            layout.addView(mChartView, new LayoutParams(LayoutParams.FILL_PARENT, LayoutParams.FILL_PARENT));
        }
        else {
        mChartView.repaint();
        }
    }
}
Community
- 1
- 1
Raghunandan
- 132,755
- 26
- 225
- 256
-
@Raghunandan : how to invisible `label text` and `legend text` vertically align – Kaushik Jul 04 '14 at 09:49
-
4For anyone wondering how to include the achartengine lib as a managed dependency to Gradle: add `repositories { maven { url "https://repository-achartengine.forge.cloudbees.com/snapshot/" } }` in your global `build.gradle`(to `buildscript` and `allprojects`), then add `compile 'org.achartengine:achartengine:1.2.0'` to your dependencies in the `build.gradle` of your module. – Blacklight Sep 02 '14 at 09:21
-
-
I am working as per above pie-chart approach.my problem is it keep spacing around piechar.can u help me? http://stackoverflow.com/questions/37159890/how-to-remove-extra-spacing-from-piechart – Vasant May 11 '16 at 10:31
18
Alternatively, if you don't want to use thrid-party libraries, you can use this formula to get points on the circle, given radius r:
x = r * Math.cos(2 * Math.PI) //This will give you r
y = r * Math.sin(2 * Math.PI) //This will give you 0
For other points of the circle you need to modify your cosine argument, for example:
x = r * Math.cos(2 * Math.PI / 6) //This will give you r/2
y = r * Math.sin(2 * Math.PI / 6) //This will give you r*sqrt(3/2)
If you want to fill out the entire circle with a fixed step n:
for(int i=0;i<n;i++) {
    x = r * Math.cos(2 * Math.PI * i / n)
    y = r * Math.sin(2 * Math.PI * i / n)
    //Draw PointF(x,y)
}
nstosic
- 2,584
- 1
- 17
- 21
-
2nice idea. but with this you will need a custom view an draw circle and use paint object to color parts of the circle. – Raghunandan Dec 30 '13 at 08:28
-
5Thank you for the feedback. AChartEngine is great library for displaying fixed values as a chart, I posted an answer only to illustrate mathematical approach with native SDK. – nstosic Dec 30 '13 at 12:16
4
Another library is PAcPie Char, you can take a look :
https://github.com/marshallino16/PacPieChart-Android
I'm still writing it but at least, it's a beginning
marshallino16
- 2,645
- 15
- 29
-
It's at the moment a simple POC but do not hesitate to fork and pull request :) – marshallino16 Aug 16 '14 at 21:33
3
If you want to have best Pie Chart do as follows:
1. Open build.gradle(Modul: app) add dependence implementation 'com.github.PhilJay:MPAndroidChart:v3.0.3'
2.Create Your_Layout as:
<?xml version="1.0" encoding="utf-8"?>
 <LinearLayout
 xmlns:android="http://schemas.android.com/apk/res/android"
    xmlns:tools="http://schemas.android.com/tools"
    android:layout_width="match_parent"
    android:layout_height="match_parent"
    xmlns:app="http://schemas.android.com/apk/res-auto"
        android:layout_gravity="center_vertical"
        android:orientation="vertical">

        <com.github.mikephil.charting.charts.PieChart
            android:id="@+id/piechart_1"
            android:layout_width="match_parent"
            android:layout_height="300sp">
        </com.github.mikephil.charting.charts.PieChart>
    </LinearLayout>
Open Your activity file and paste the following codes:
public class YourActivity extends AppCompatActivity{

        protected void onCreate(Bundle saveInstanceState)
{
          super.onCreate(saveInstanceState);
          setContentView(R.layout.Your_layout);
          setPieChart(); }

         public void setPieChart() {
                    this.pieChart = pieChart;
                    pieChart.setUsePercentValues(true);
                    pieChart.getDescription().setEnabled(true);
                    pieChart.setExtraOffsets(5,10,5,5);
                    pieChart.setDragDecelerationFrictionCoef(0.9f);
                    pieChart.setTransparentCircleRadius(61f);
                    pieChart.setHoleColor(Color.WHITE);
                    pieChart.animateY(1000, Easing.EasingOption.EaseInOutCubic);
                    ArrayList<PieEntry> yValues = new ArrayList<>();
                    yValues.add(new PieEntry(34f,"Ilala"));
                    yValues.add(new PieEntry(56f,"Temeke"));
                    yValues.add(new PieEntry(66f,"Kinondoni"));
                    yValues.add(new PieEntry(45f,"Kigamboni"));

                    PieDataSet dataSet = new PieDataSet(yValues, "Desease Per
                     Regions");
                    dataSet.setSliceSpace(3f);
                    dataSet.setSelectionShift(5f);
                    dataSet.setColors(ColorTemplate.COLORFUL_COLORS);
                    PieData pieData = new PieData((dataSet));
                    pieData.setValueTextSize(10f);
                    pieData.setValueTextColor(Color.YELLOW);
                    pieChart.setData(pieData);
                    //PieChart Ends Here
                }
}
It Will Give you Pie Chart shown Below;

The Library can also be used for Drawing Bar Graphs, LineGraphs,Horizontal Bar Graphs Etc
eli
- 8,571
- 4
- 30
- 40
-
@BjörnHallström using same library but its not showing all lables if legend is vertically shown right to pieChart – Erum Dec 13 '18 at 05:17
-
-
2
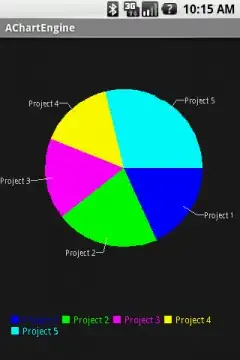
I think your best friend is aChartEngine.
It's easy to use and provides a wide range of charts to display.
Example of a pie chart:
Phantômaxx
- 37,901
- 21
- 84
- 115
-
-
@Vasant http://stackoverflow.com/questions/6503563/how-to-make-disable-to-show-zoom-pane-in-achartengine – Phantômaxx May 11 '16 at 09:22
-
2
If you don't want to use any third party library,try sample form google. They provide a sample to draw pie chart in their Custom Drawing documentation.
Alvi
- 767
- 8
- 20
1
Open up build.gradle (module:app) and add the library in the dependencies.
implementation 'com.github.lecho:hellocharts-library:1.5.8@aar'
Next you need to open up build.gradle (Project) and add Jcenter because this library is available through it.
allprojects {
repositories {
    google()
    jcenter()
}
}
Now sync your project by clicking on Sync Now.
Open up activity_main.xml and add the following code for Android pie chart view.
< ?xml version="1.0" encoding="utf-8"?>
<LinearLayout xmlns:android="http://schemas.android.com/apk/res/android"
xmlns:app="http://schemas.android.com/apk/res-auto"
xmlns:tools="http://schemas.android.com/tools"
android:layout_width="match_parent"
android:layout_height="match_parent"
android:orientation="vertical"
 tools:context="com.codingdemos.codingdemos.MainActivity">
<lecho.lib.hellocharts.view.PieChartView
android:id="@+id/chart"
android:layout_width="match_parent"
android:layout_height="match_parent" />
< /LinearLayout>
Here is the code for MainActivity.java file.
public class MainActivity extends AppCompatActivity {
    PieChartView pieChartView;

@Override
protected void onCreate(Bundle savedInstanceState) {
    super.onCreate(savedInstanceState);
    setContentView(R.layout.activity_main);

    pieChartView = findViewById(R.id.chart);

    List pieData = new ArrayList<>();
    pieData.add(new SliceValue(15, Color.BLUE).setLabel("Q1: $10"));
    pieData.add(new SliceValue(25, Color.GRAY).setLabel("Q2: $4"));
    pieData.add(new SliceValue(10, Color.RED).setLabel("Q3: $18"));
    pieData.add(new SliceValue(60, Color.MAGENTA).setLabel("Q4: $28"));

    PieChartData pieChartData = new PieChartData(pieData);
    pieChartData.setHasLabels(true).setValueLabelTextSize(14);
    pieChartData.setHasCenterCircle(true).setCenterText1("Sales in million").setCenterText1FontSize(20).setCenterText1Color(Color.parseColor("#0097A7"));
    pieChartView.setPieChartData(pieChartData);
}
}
you can see https://www.codingdemos.com/android-pie-chart-tutorial/ for more description.
M Karimi
- 1,991
- 1
- 17
- 34