6

Using the ASP.Net Chart Controls, which are a subset of the Dundas Chart Controls,

How can I make charts that look like this:
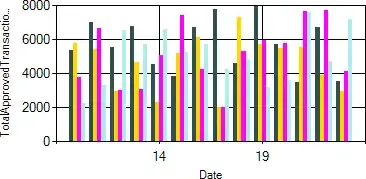
alt text

Instead of this:

MS Chart Example

EDIT: I've made some progress, since asking this question. The styling elements that improve the default graph in both Dundas and MSChart are:

  • Round Corners on the chart container
  • Background colours and gradients on chart container
  • Transparency on column colours
  • Alignment of columns in the x axis (bizarely, MSChart defaults to z axis alignment)
  • Area 3D wall width
Community
  • 1
  • 1
grenade
  • 31,451
  • 23
  • 97
  • 126

2 Answers2

5

I know it's a bit late, but I was playing with the chart for a project I'm working on.

Color="#960080ff"

The first set of two digits in the color are for the alpha channel. I've got it set for 96 which is semi transparent.

enjoy

NeutronJack
  • 51
  • 1
  • 2
1

Try setting the Area3DStyle.Enable3D property to true.

More info about the 3D style can be found here: http://msdn.microsoft.com/en-us/library/dd489232%28VS.100%29.aspx

Pbirkoff
  • 4,642
  • 2
  • 20
  • 18
  • That's true, but sadly, the default 3d styles are even uglier than the default 2d styles. I'm looking for a way to add transparencies and gradients (as well as 3d). Thanks for that link though. It look's like there's a bit more documentation there. – grenade Jan 22 '10 at 14:14
  • I have the same problem. I don't understand how to make 3d chart series transparent. Only way to do that I've found is to use SemiTransparent pallete. But that destroys my selected BrightPastel pallete whit I want use. In the examples are 3d charts, which are using BrightPastel too but are also transparent. I haven't discovered way they are doing it. – Crank Aug 05 '10 at 10:47