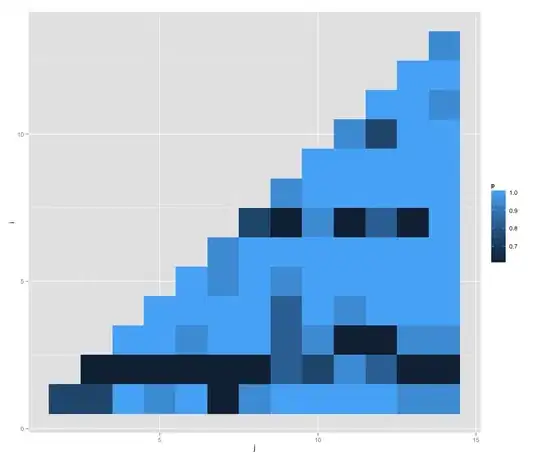
I have the following data:
dat <- lapply(1:84, function(l) rnorm(20) )
mat <- matrix(dat, nrow=6, ncol=14)
For each column, I now want to perform a paired statistical test between each pairwise combination of rows. What is the most vectorized, and hence efficient way of doing this so that I can extract a matrix of p values for each column?
Also, what is the best way to display or visualize the resultant pairwise P-values? A matrix? If so, there will be 36-15 cells that are redundant. Perhaps there is a better way?
